This is the SDTWFC analysis of the 1956 Atlantic hurricane season. Simulated images are provided for storms that reached hurricane intensity. Tropical depressions with no known dates or strengths were not included due to a lack of information. Additionally, there is no track data for Judy and Molly, but they are still included.
Storms[]

| Tropical storm (NHC) | |
 | |
| Duration | June 7 – 10 |
|---|---|
| Peak intensity | 85 km/h (50 mph) (1-min) 999 hPa (mbar) |
Tropical Storm Anna[]
(Previously Tropical Storm One)
| Tropical storm (NHC) | |
 | |
| Duration | June 12 – June 16 |
|---|---|
| Peak intensity | 100 km/h (65 mph) (1-min) 996 hPa (mbar) |
Tropical Storm Betsy[]
(Previously Tropical Storm Two)
| Tropical storm (NHC) | |
 | |
| Duration | July 6 – July 9 |
|---|---|
| Peak intensity | 65 km/h (40 mph) (1-min) 1002 hPa (mbar) |
Tropical Storm Carla[]
(Previously July Tropical Depression)
| Category 1 tropical cyclone (NHC) | |
  | |
| Duration | July 25 – July 28 |
|---|---|
| Peak intensity | 130 km/h (80 mph) (1-min) 990 hPa (mbar) |
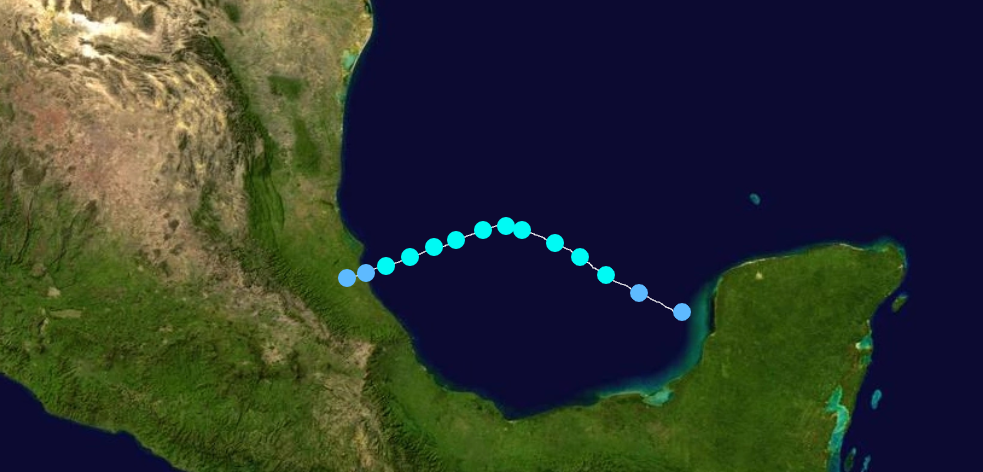
Hurricane Dora[]
(Previously Hurricane Anna)
| Category 3 tropical cyclone (NHC) | |
  | |
| Duration | August 9 – August 22 |
|---|---|
| Peak intensity | 205 km/h (125 mph) (1-min) 953 hPa (mbar) |
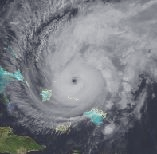
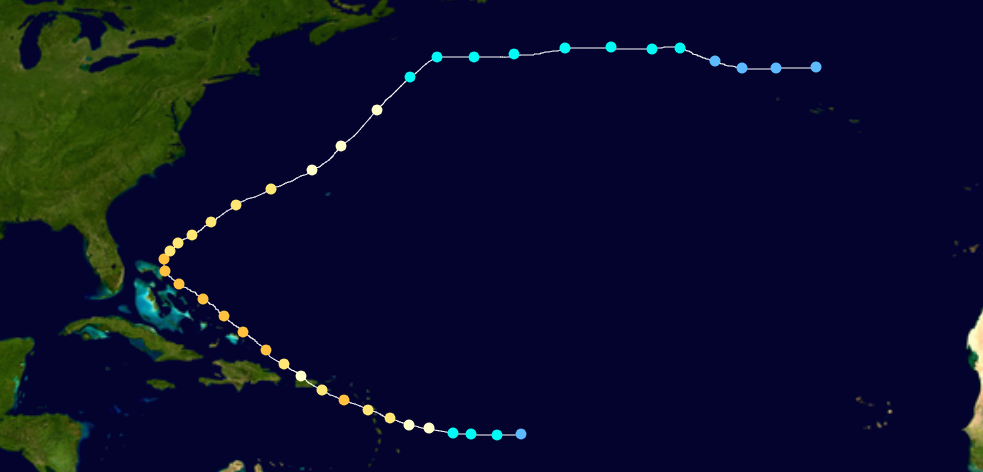
Hurricane Ethel[]
(Previously Hurricane Betsy)
| Category 1 tropical cyclone (NHC) | |
  | |
| Duration | September 7 – September 14 |
|---|---|
| Peak intensity | 130 km/h (80 mph) (1-min) 980 hPa (mbar) |
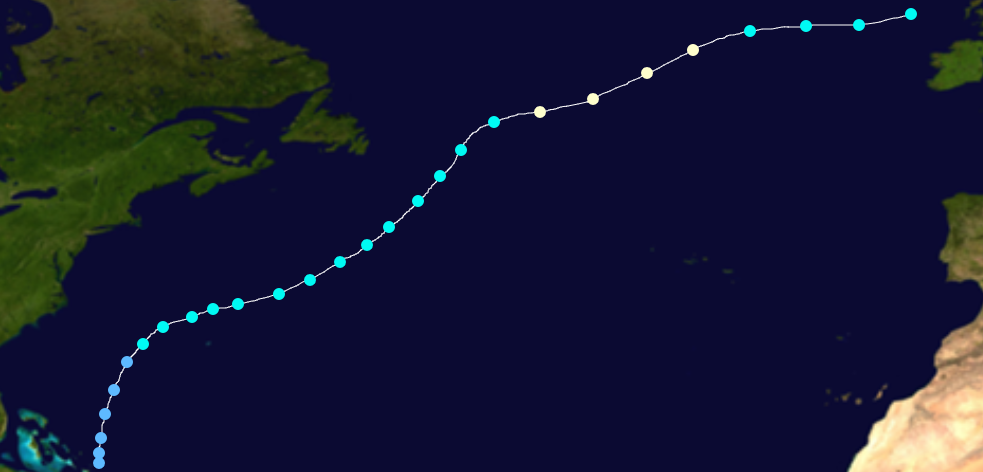
Hurricane Flossy[]
(Previously Tropical Storm Carla)
| Tropical storm (NHC) | |
 | |
| Duration | September 10 – September 14 |
|---|---|
| Peak intensity | 110 km/h (70 mph) (1-min) 993 hPa (mbar) |
Tropical Storm Greta[]
(Previously Tropical Storm Dora)
| Tropical storm (NHC) | |
 | |
| Duration | September 11 – September 14 |
|---|---|
| Peak intensity | 85 km/h (50 mph) (1-min) 998 hPa (mbar) |
Tropical Storm Hattie[]
(Previously Tropical Storm Ethel)
| Category 2 tropical cyclone (NHC) | |
  | |
| Duration | September 20 – October 3 |
|---|---|
| Peak intensity | 155 km/h (95 mph) (1-min) 974 hPa (mbar) |
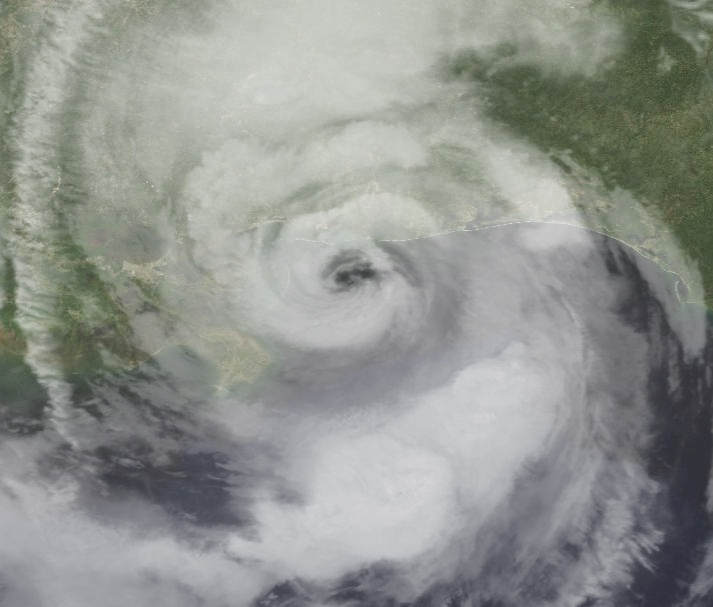
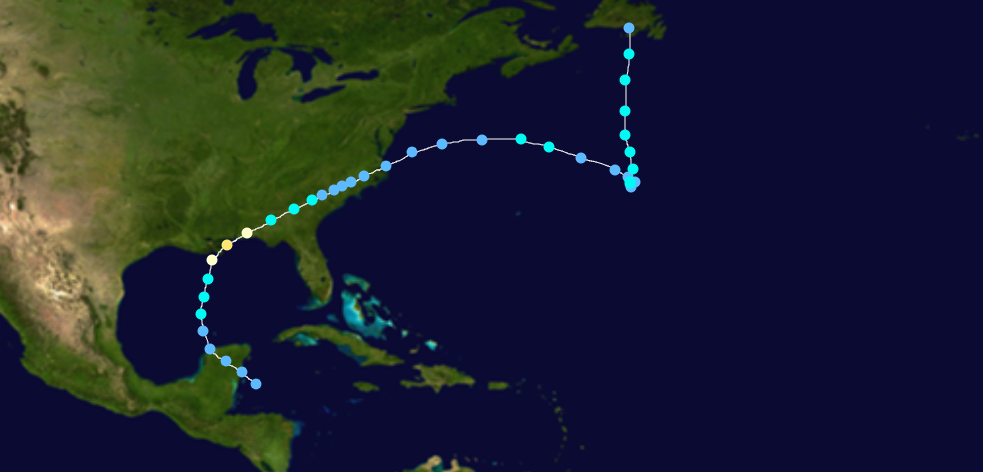
Hurricane Inez[]
(Previously Hurricane Inez)
| Tropical storm (NHC) | |
 | |
| Duration | October 9 – October 12 |
|---|---|
| Peak intensity | 75 km/h (45 mph) (1-min) 1004 hPa (mbar) |
Tropical Storm Judy[]
(Previously Tropical Storm Nine)
| Category 1 tropical cyclone (NHC) | |
  | |
| Duration | October 14 – October 19 |
|---|---|
| Peak intensity | 120 km/h (75 mph) (1-min) 991 hPa (mbar) |
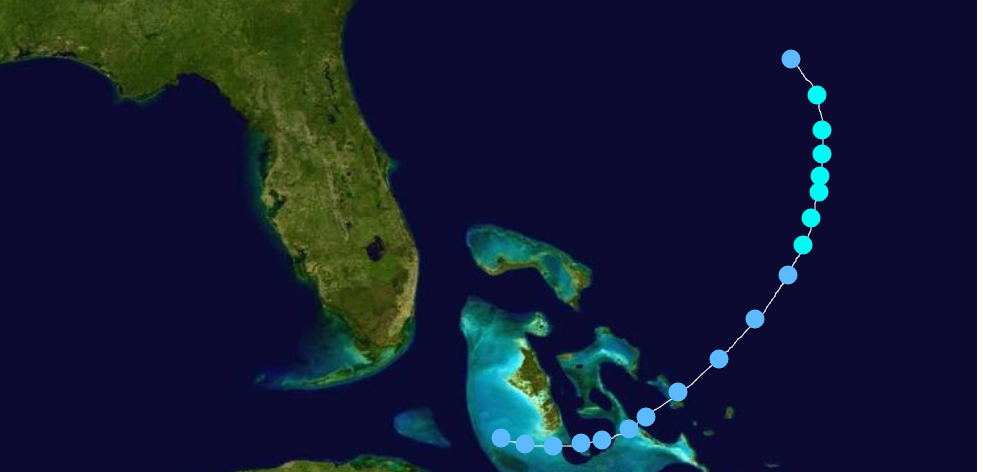
Hurricane Kitty[]
(Previously Tropical Storm Ten)
| Category 3 tropical cyclone (NHC) | |
  | |
| Duration | October 31 – November 7 |
|---|---|
| Peak intensity | 185 km/h (115 mph) (1-min) 968 hPa (mbar) |
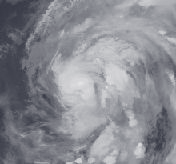
Hurricane Laura[]
(Previously Hurricane Greta)
| Tropical storm (NHC) | |
| | |
| Duration | November 19 – November 21 |
|---|---|
| Peak intensity | 75 km/h (45 mph) (1-min) 1002 hPa (mbar) |
Tropical Storm Molly[]
(Previously Tropical Storm Twelve)
Storm Names[]
The 1956 names were the first time those names were used in the Atlantic Basin. No names were retired this year, thus the 1962 season had the same list.
|
|
|
Season Effects[]
| Storm name |
Dates active | Storm category at peak intensity |
Max 1-min wind mph (km/h) |
Min. press. (mbar) |
Areas affected | Damage (USD) |
Deaths | |||
|---|---|---|---|---|---|---|---|---|---|---|
| Anna | June 7 - June 10 | Tropical storm | 50 (85) | 999 | Outer Banks | none | 0 | |||
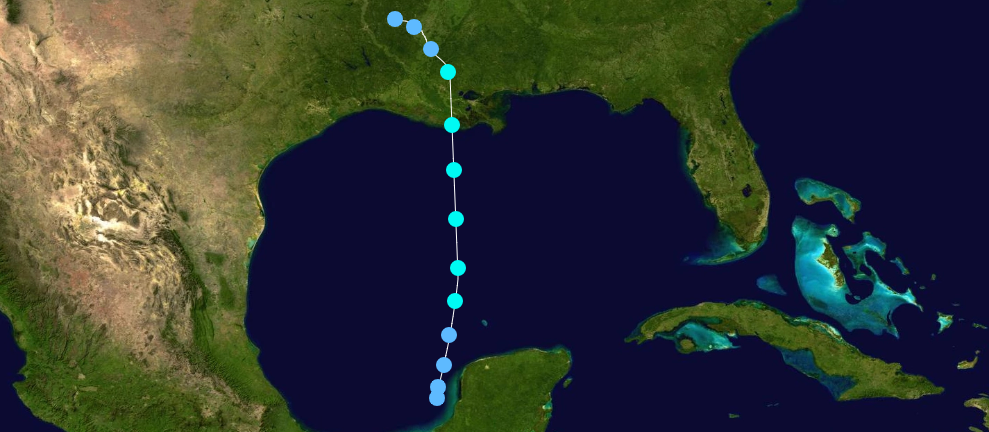
| Betsy | June 12 - June 16 | Tropical storm | 65 (100) | 996 | Yucatan Peninsula, Louisiana, Mississippi, Arkansas | .5 (2018 USD) | 4 | |||
| Carla | July 6 - July 9 | Tropical storm | 40 (65) | 1002 | Florida Panhandle, Alabama, Mississippi, Tennessee | 4.5 (2018 USD) | 0 | |||
| Dora | July 25 - July 28 | Category 1 hurricane | 80 (130) | 990 | Mexico | .5 | 0 | |||
| Ethel | August 9 - August 22 | Category 3 hurricane | 125 (205) | 953 | Lesser Antilles, Puerto Rico, Dominican Republic, Haiti, Turks and Caicos, Bahamas, United States East Coast, Bermuda, Azores | 450 (2018 USD) | 36 (1) | |||
| Flossy | September 7 - September 14 | Category 1 hurricane | 80 (130) | 980 | Turks and Caicos, Bahamas, Bermuda, United Kingdom | none | 0 | |||
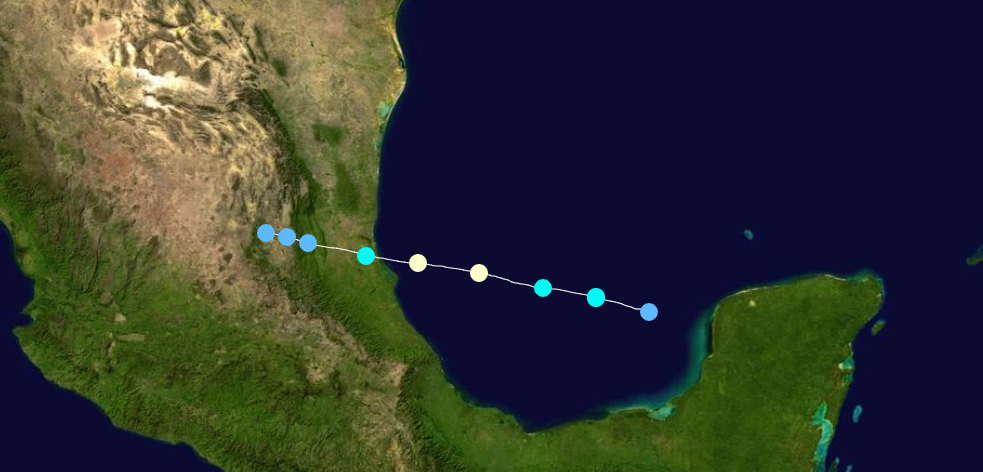
| Greta | September 10 - September 14 | Tropical storm | 70 (110) | 993 | Mexico | Minor | 27 | |||
| Hattie | September 11 - September 14 | Tropical storm | 50 (85) | 998 | Bahamas | none | 0 | |||
| Inez | September 20 - October 3 | Category 2 hurricane | 95 (155) | 974 | Yucatan Peninsula, Louisiana, Mississippi, Alabama, Florida Panhandle, Georgia, South Carolina, North Carolina, Virginia, Delaware, New Foundland | 227 (2018 USD) | 15 | |||
| Judy | October 9 - October 12 | Tropical storm | 45 (75) | 1004 | none | none | 0 | |||
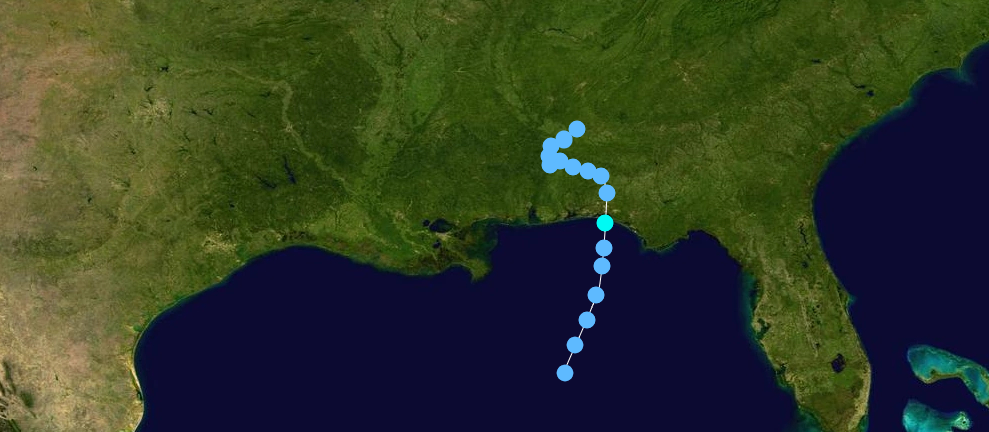
| Kitty | October 14 - October 19 | Category 1 hurricane | 75 (120) | 991 | Cuba, United States East Coast | 27 (2018 USD) | 3 | |||
| Laura | October 31 - November 7 | Category 3 hurricane | 115 (185) | 968 | Cuba, Bahamas, Turks and Caicos, Southeast United States, Hispaniola, Puerto Rico, Lesser Antilles | 32 (2018 USD) | 1 | |||
| Molly | November 19 - November 21 | Tropical storm | 45 (75) | 1002 | none | none | 0 | |||
| Season aggregates | ||||||||||
| 13 | June 7 - November 21 | 125 (205) | 953 | North Atlantic | 736.5 (2018 USD) | 86 (1) | ||||