The 1993 Atlantic hurricane season began on June 1st, 1993 and will end November 30th, 1993.
Seasonal forecasts[]
| Source | Date | Named
storms |
Hurricanes | Major
hurricanes | |
| NOAA | May 8, 1993 | 10 | 6 | 2 | |
| ––––––––––––––––––––––––––––––––––––––––––––––––––––––– | |||||
| Actual activity | 9 | 6 | 2 | ||
Season Summary[]
Storms[]
|
Hurricane Arlene[]
| Category 3 hurricane (SSHWS) | |
  | |
| Duration | June 30 – July 7 |
|---|---|
| Peak intensity | 115 mph (185 km/h) (1-min) 959 mbar (hPa) |
Tropical Storm Bret[]
| Tropical storm (SSHWS) | |
  | |
| Duration | July 17 – July 22 |
|---|---|
| Peak intensity | 60 mph (95 km/h) (1-min) 995 mbar (hPa) |
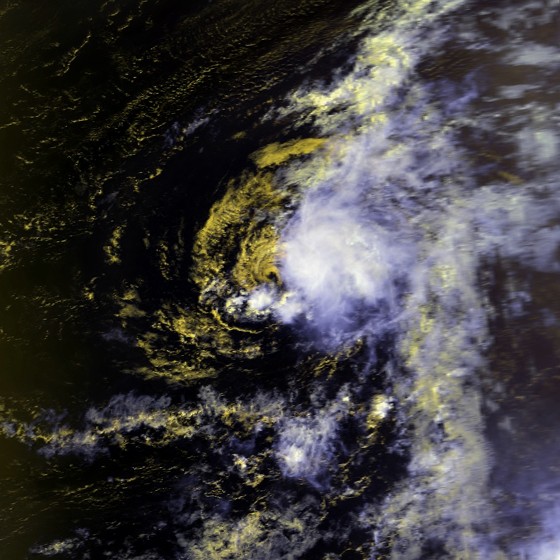
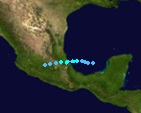
Tropical Storm Cindy[]
| Tropical storm (SSHWS) | |
  | |
| Duration | August 1 – August 6 |
|---|---|
| Peak intensity | 50 mph (85 km/h) (1-min) 997 mbar (hPa) |
Hurricane Dennis[]
| Category 1 hurricane (SSHWS) | |
  | |
| Duration | August 3 – August 12 |
|---|---|
| Peak intensity | 85 mph (140 km/h) (1-min) 979 mbar (hPa) |
Hurricane Emily[]
| Category 4 hurricane (SSHWS) | |
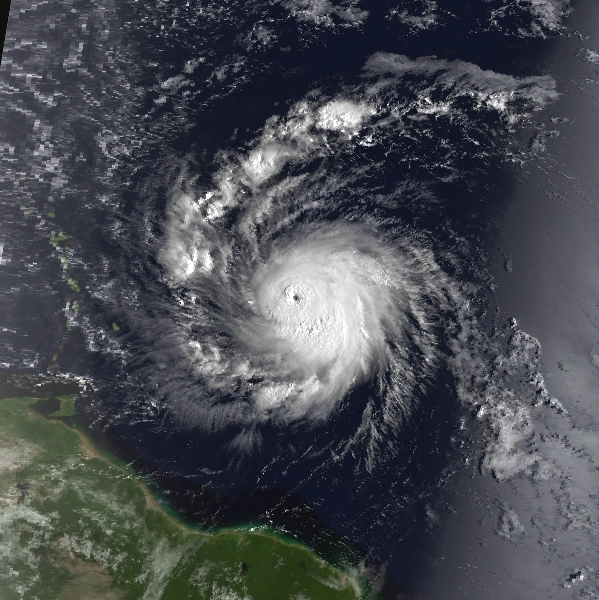  | |
| Duration | August 31 – September 12 |
|---|---|
| Peak intensity | 145 mph (230 km/h) (1-min) 934 mbar (hPa) |
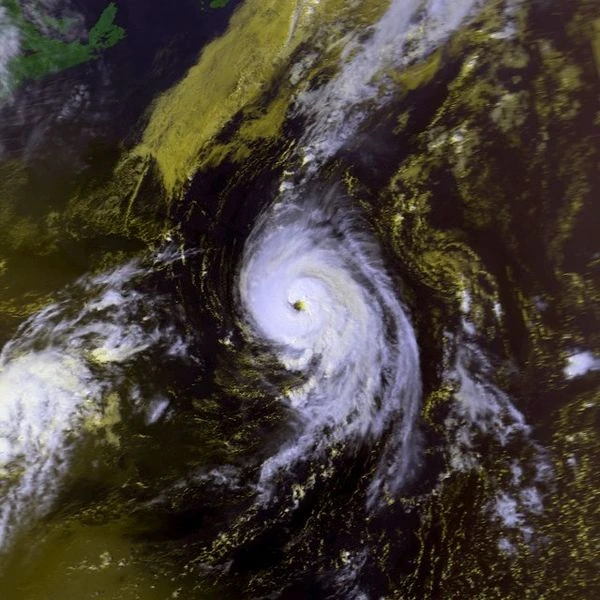
Hurricane Floyd[]
| Category 4 hurricane (SSHWS) | |
  | |
| Duration | September 2 – September 21 |
|---|---|
| Peak intensity | 135 mph (215 km/h) (1-min) 940 mbar (hPa) |
Hurricane Gert[]
| Category 2 hurricane (SSHWS) | |
  | |
| Duration | September 10 – September 22 |
|---|---|
| Peak intensity | 110 mph (175 km/h) (1-min) 961 mbar (hPa) |
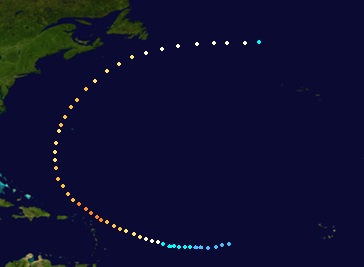
Hurricane Harvey[]
| Category 5 hurricane (SSHWS) | |
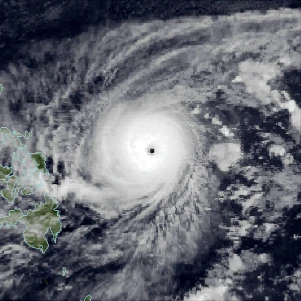  | |
| Duration | September 10 – September 24 |
|---|---|
| Peak intensity | 165 mph (270 km/h) (1-min) 910 mbar (hPa) |
Tropical Storm Irene[]
| Tropical storm (SSHWS) | |
  | |
| Duration | September 17 – September 22 |
|---|---|
| Peak intensity | 50 mph (85 km/h) (1-min) 996 mbar (hPa) |
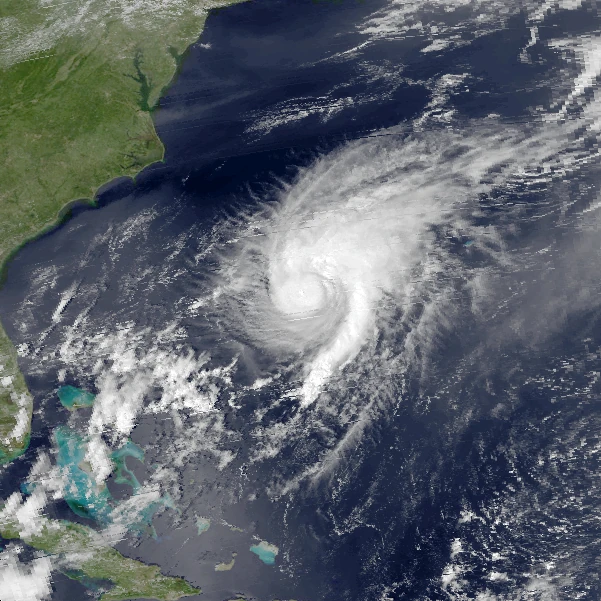
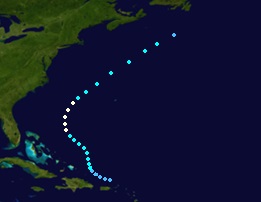
Hurricane Jose[]
| Category 2 hurricane (SSHWS) | |
  | |
| Duration | September 20 – September 30 |
|---|---|
| Peak intensity | 105 mph (165 km/h) (1-min) 965 mbar (hPa) |
Hurricane Katrina[]
| Category 1 hurricane (SSHWS) | |
  | |
| Duration | September 26 – October 1 |
|---|---|
| Peak intensity | 75 mph (120 km/h) (1-min) 987 mbar (hPa) |
Tropical Storm Lenny[]
| Tropical storm (SSHWS) | |
  | |
| Duration | September 30 – October 2 |
|---|---|
| Peak intensity | 45 mph (75 km/h) (1-min) 999 mbar (hPa) |
Hurricane Maria[]
| Category 1 hurricane (SSHWS) | |
  | |
| Duration | October 19 – October 25 |
|---|---|
| Peak intensity | 80 mph (130 km/h) (1-min) 981 mbar (hPa) |
Tropical Storm Nate[]
| Tropical storm (SSHWS) | |
  | |
| Duration | October 31 – November 4 |
|---|---|
| Peak intensity | 60 mph (95 km/h) (1-min) 992 mbar (hPa) |
Timeline[]

Storm names[]
The following names will be used to name tropical and subtropical cyclones in the 1993 season.
|
|
|
Accumulated Cyclone Energy (ACE) Rating[]
| ACE (104 kt2) – Storm: Source | |||||
|---|---|---|---|---|---|
| 1 | 0.00 | Storm | 12 | 0.00 | Storm |
| 2 | 0.00 | Storm | 13 | 0.00 | Storm |
| 3 | 0.00 | Storm | 14 | 0.00 | Storm |
| 4 | 0.00 | Storm | 15 | 0.00 | Storm |
| 5 | 0.00 | Storm | 16 | 0.00 | Storm |
| 6 | 0.00 | Storm | 17 | 0.00 | Storm |
| 7 | 0.00 | Storm | 18 | 0.00 | Storm |
| 8 | 0.00 | Storm | 19 | 0.00 | Storm |
| 9 | 0.00 | Storm | 20 | 0.00 | Storm |
| 10 | 0.00 | Storm | 21 | 0.00 | Storm |
| 11 | 0.00 | Storm | 22 | 0.00 | Storm |
| Total=0.0 | |||||
ACE is the result of a storm's winds multiplied by how long it lasted for, so storms or subtropical storms (Originally not included up until 2012) that at lasted a long time , as well as particularly strong hurricanes , have higher ACE totals. Tropical Depressions are not included in season total.
Season effects[]
This is a table of the storms and their effects in the 1993 Atlantic hurricane season. This table includes the storm's names, duration, peak intensity, Areas affected (bold indicates made landfall in that region at least once), damages, and death totals. Deaths in parentheses are additional and indirect (an example of an indirect death would be a traffic accident), but are still storm-related. Damage and deaths include totals while the storm was extratropical, a wave or a low. All of the damage figures are in 2015 USD (the listed damage figure is in millions).
| Storm name |
Dates active | Storm category at peak intensity |
Max 1-min wind mph (km/h) |
Min. press. (mbar) |
Areas affected | Damage (USD) |
Deaths |
|---|---|---|---|---|---|---|---|
| One | June 7 – June 9 | Tropical depression | 35 (55) | 1002 | Mexico | 5 | 1 |