The 2017 Atlantic hurricane season is an ongoing event in the annual formation of tropical cyclones in the Atlantic basin. The season officially began on June 1, and will end on November 30, 2017. These dates historically describe the period of year when most tropical cyclones form in the Atlantic basin and are adopted by convention. However, as shown by Tropical Storm Arlene in April, the formation of tropical cyclones is possible at any time of the year.
For the third consecutive year activity began early, with the formation of Tropical Storm Arlene on April 19, nearly a month and a half before the official start of the season. It is only the second named storm on record to exist in the month in April, with the first being Ana in 2003, as well as the strongest overall for the month of April. In mid-June, Tropical Storm Bret struck the island of Trinidad, which rarely gets hit by tropical cyclones. Tropical Storm Cindy struck the state of Louisiana a few days later, becoming the first tropical cyclone to strike the state since Hurricane Isaac in 2012.
Beginning this year, the National Hurricane Center has the option to issue advisories, and thus allow watches and warnings to be issued, on disturbances that are not yet tropical cyclones but have a high chance to become one, and are expected to bring tropical storm or hurricane conditions to landmasses within 48 hours. Such systems are termed "potential tropical cyclones". Advisories on these storms contain the same content, including track forecasts and cyclone watches and warnings, as advisories on active tropical cyclones.[1] This was first demonstrated on June 18 with the designation of Potential Tropical Cyclone Two—which later developed into Tropical Storm Bret—east-southeast of the Windward Islands.[2]
Seasonal forecasts[]
Ahead of and during the season, several national meteorological services and scientific agencies forecast how many named storms, hurricanes and major (Category 3 or higher on the Saffir–Simpson scale) hurricanes will form during a season and/or how many tropical cyclones will affect a particular country. These agencies include the Tropical Storm Risk (TSR) Consortium of the University College London, the National Oceanic and Atmospheric Administration (NOAA) and Colorado State University (CSU). The forecasts include weekly and monthly changes in significant factors that help determine the number of tropical storms, hurricanes, and major hurricanes within a particular year.[4] Some of these forecasts also take into consideration what happened in previous seasons and the dissipation of the 2014–16 El Niño event. On average, an Atlantic hurricane season between 1981 and 2010 contained twelve tropical storms, six hurricanes, and two major hurricanes, with an Accumulated Cyclone Energy (ACE) index of between 66 and 103 units.[3]
Pre-season outlooks[]
The first forecast for the year was issued by TSR on December 13, 2016.[4] They anticipated that the 2017 season would be a near-average season, with a prediction of 14 named storms, 6 hurricanes, and 3 major hurricanes. They also predicted an ACE index of around 101 units.[4] On December 14, CSU released a qualitative discussion detailing five possible scenarios for the 2017 season, taking into account the state of the Atlantic Multidecadal Oscillation and the possibility of El Niño developing during the season.[15] TSR lowered their forecast numbers on April 5, 2017 to 11 named storms, 4 hurricanes, and 2 major hurricanes, based on recent trends favoring the development of El Niño.[5] The next day, CSU released their prediction, also predicting a total of 11 named storms, 4 hurricanes, and 2 major hurricanes.[6] On April 17, The Weather Company released their forecasts, calling for 2017 to be a near-average season, with a total of 12 named storms, 6 hurricanes, and 2 major hurricanes.[7] The next day, on April 18, North Carolina State University released their prediction, also predicting a near-average season, with a total of 11–15 named storms, 4–6 hurricanes, and 1–3 major hurricanes.[8] On May 20, The Weather Company issued an updated forecast, raising their numbers to 14 named storms, 7 hurricanes, and 3 major hurricanes to account for Tropical Storm Arlene as well as the decreasing chance of El Niño forming during the season.[9] On May 25, NOAA released their prediction, citing a 70% chance of an above average season due to "a weak or nonexistent El Niño", calling for 11–17 named storms, 5–9 hurricanes, and 2–4 major hurricanes.[10] On May 26, TSR updated its prediction to around the same numbers as its December 2016 prediction, with only a minor change in the expected ACE index amount to 98 units.[11]
Mid-season outlooks[]
CSU updated their forecast on June 1 to include 14 named storms, 6 hurricanes and 2 major hurricanes to include Tropical Storm Arlene.[12] It was based on the current status of the North Atlantic Oscillation, which was showing signs of leaning towards a negative phase, favoring a warmer tropical Atlantic; and the chances of El Niño forming were significantly lower. However, they stressed on the uncertainty that the El Niño–Southern Oscillation could be in a warm-neutral phase or weak El Niño conditions by the peak of the season.[12] On July 4, TSR released their fourth forecast for the season, increasing their predicted numbers to 17 named storms, 7 hurricanes, and 3 major hurricanes, due to the fact that El Niño conditions would no longer develop by the peak of the season and the warming of sea-surface temperatures across the basin. Additionally, they predicted a revised ACE index of 116 units.[13]a
Seasonal summary[]

The Atlantic hurricane season officially began on June 1, 2017, although activity began earlier for the third consecutive year, the first being 2015. Roughly a month or so before the official start, the first storm, Arlene, developed on April 19 in the northern Atlantic Ocean. It was the first named storm to develop in the month of April since Ana in 2003. Activity quieted down during May and for the first half of June. Shortly afterwards, by June 20, two more storms had developed; the first was Bret, which was an unusual and rare storm that affected areas in the southeastern Caribbean Sea, including Trinidad and Tobago. The second, Cindy, formed in the Gulf of Mexico less than a day after Bret had developed, the first such occurrence on record. In early July, a tropical depression developed in the Main Development Region (MDR), the second tropical cyclone to develop in the MDR before the month of August; the previous was Bret. Ten days elapsed before the development of the next named storm, Tropical Storm Don, on July 17. Later in July, Tropical Depression Six developed and is currently near Cape Verde.
Systems[]
Tropical Storm Arlene[]
| Major tropical disturbance (HIHQ) | |
| Tropical storm (SSHWS) | |
  | |
| Duration | April 19 – April 21 |
|---|---|
| Peak intensity | 50 mph (85 km/h) (1-min) 993 mbar (hPa) |
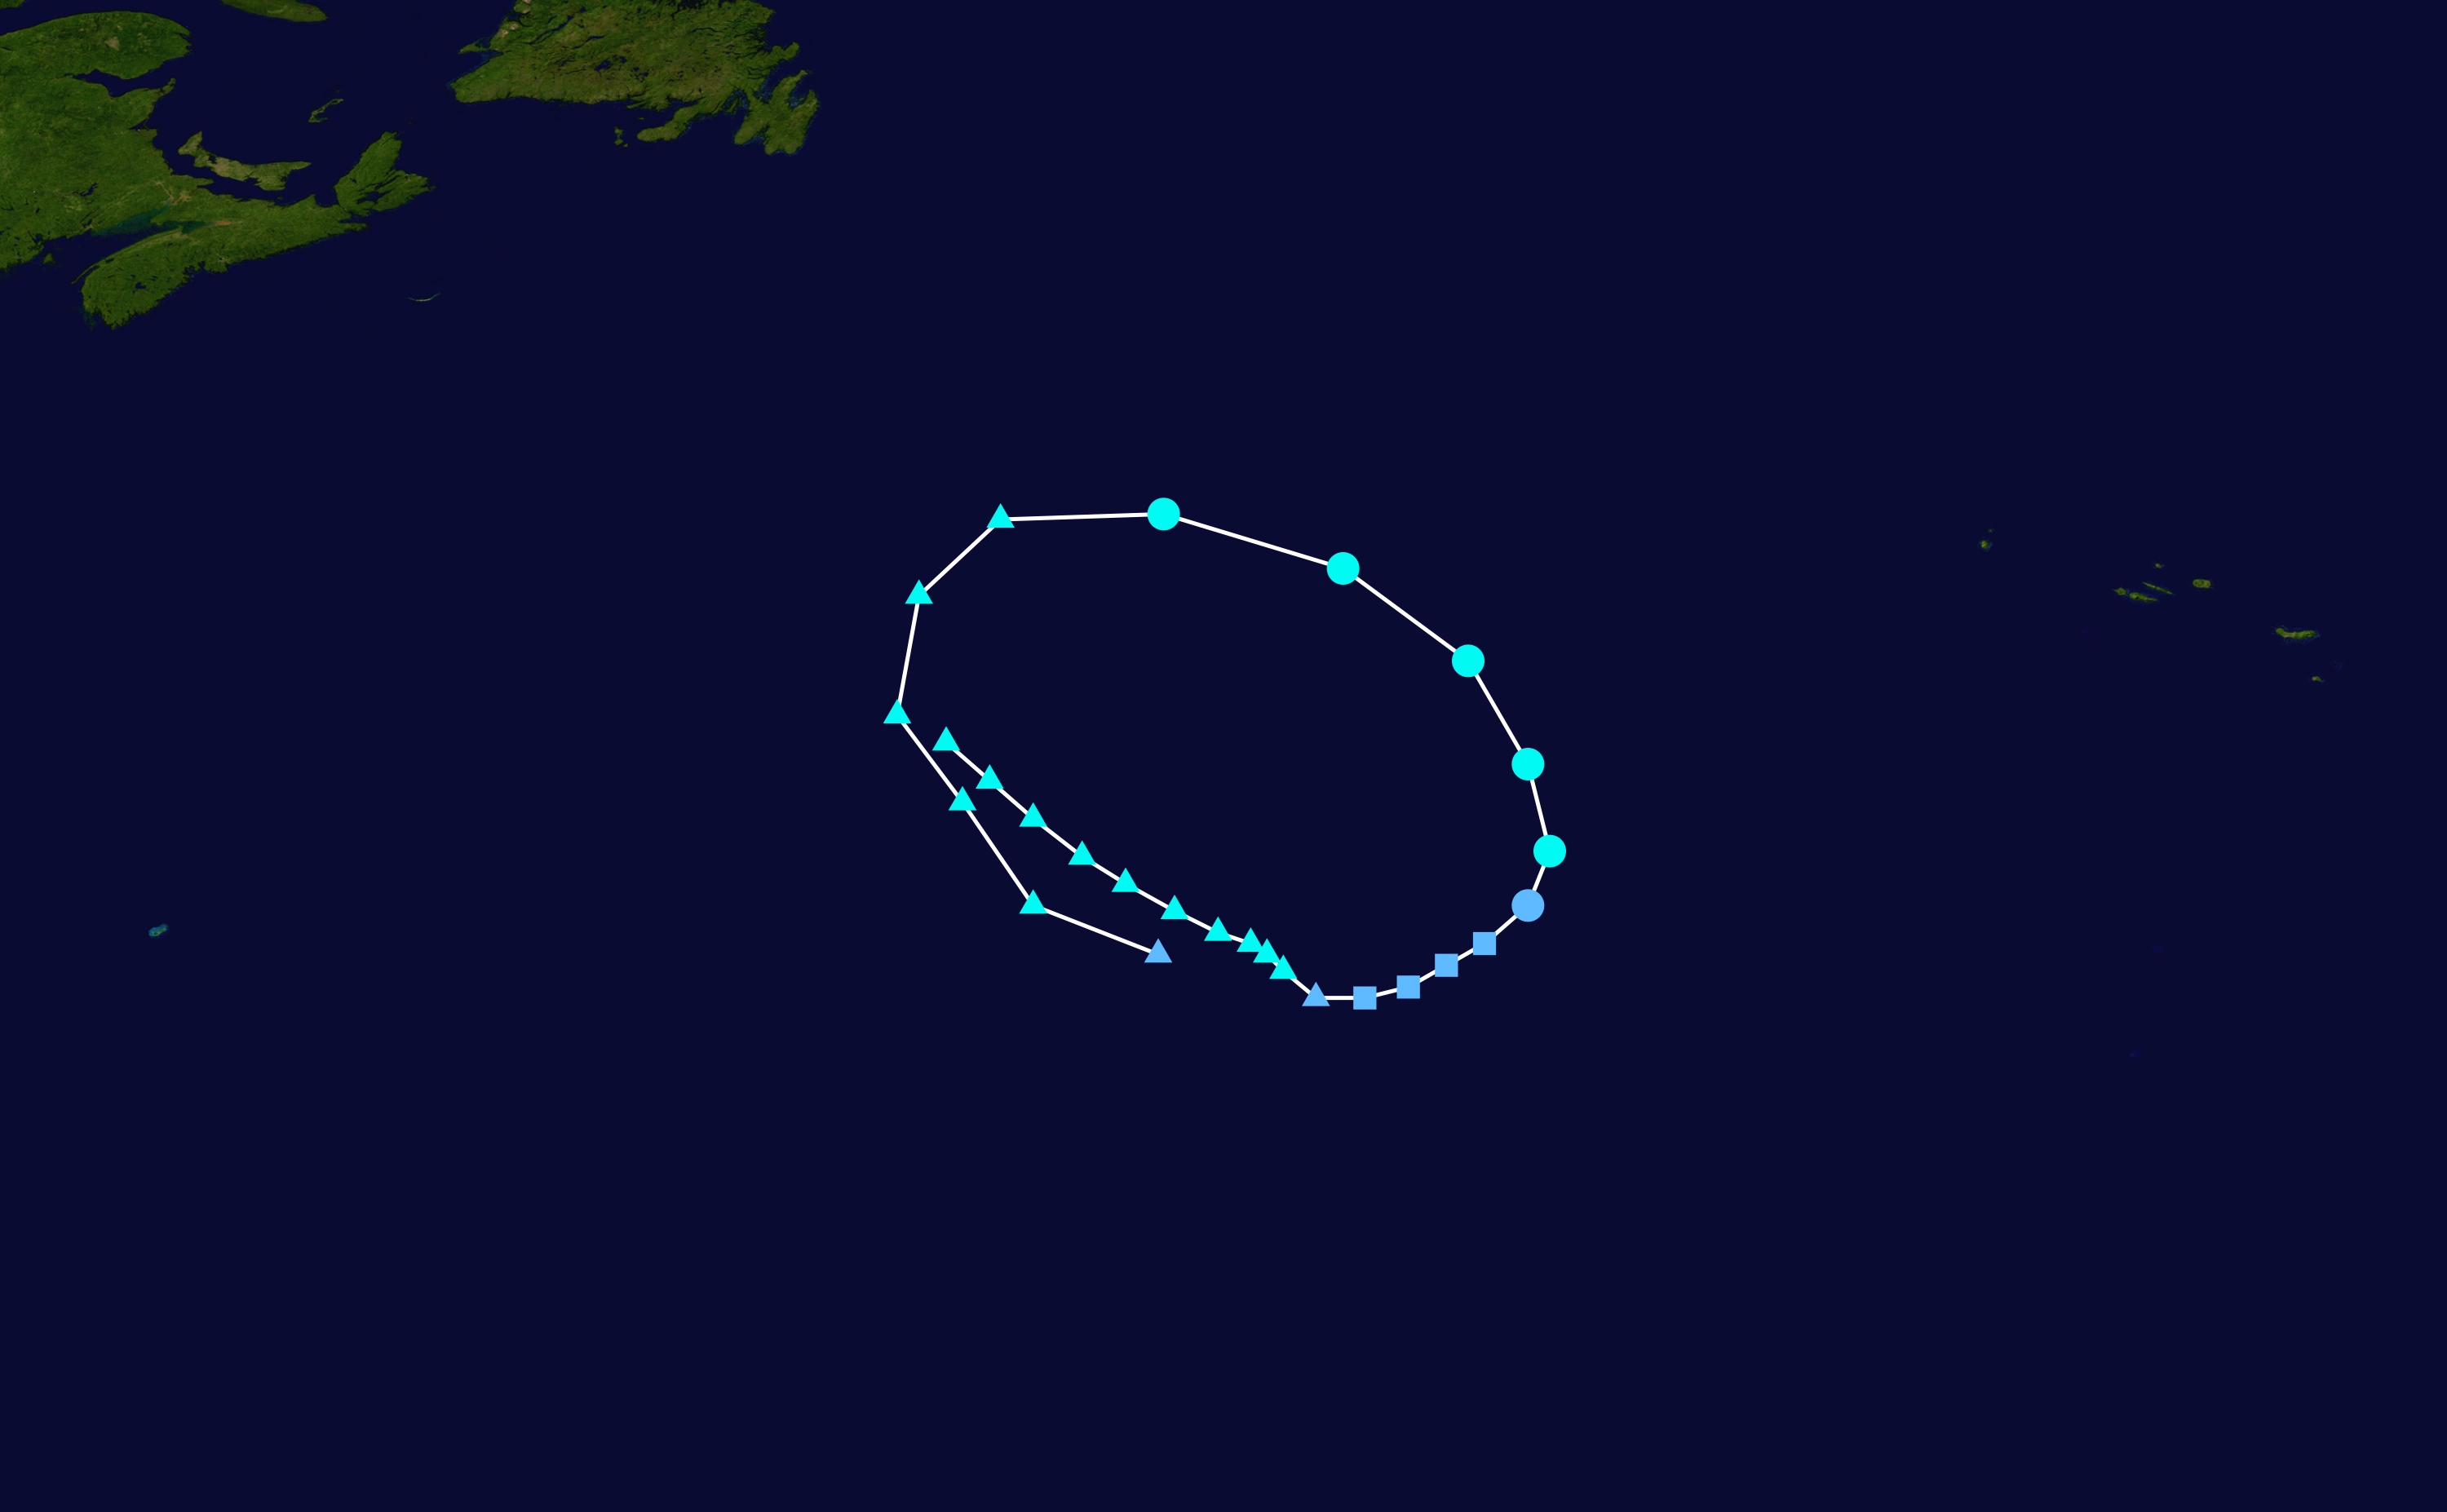
An extratropical cyclone formed along a cold front well to the southeast of Newfoundland on April 15, producing waves as high as 40 feet (12 m) over subsequent days.[16] The system initially failed to organize appreciably; by April 17, however, sporadic convection began to coalesce around an increasingly well defined circulation. This process continued with the formation of a curved banding feature near the center on April 19, prompting the National Hurricane Center (NHC) to upgrade the low to Subtropical Depression One at 15:00 UTC that day.[17] At this time, the system was situated 890 mi (1,435 km) southwest of the Azores.[18] Little change in strength occurred throughout the day.[19]
Convection became more concentrated and the system's wind field contracted during the early morning hours of April 20, and the system transitioned to a fully tropical cyclone at 15:00 UTC that day.[20] Six hours later, despite forecasts predicting it would dissipate, the storm unexpectedly strengthened into Tropical Storm Arlene.[21] Revolving around a low to its west, Arlene defied forecasts again and attained a peak intensity of 50 mph (85 km/h) at 03:00 UTC on April 21, despite a deteriorating satellite presentation.[22] Twelve hours later, however, Arlene became embedded within the aforementioned larger extratropical cyclone, and lost its identity as a tropical cyclone.[23] Arlene's remnants continued to persist through the next day, executing a counterclockwise loop around the larger extratropical cyclone, while in the process of merging with it.[24] Early on April 23, the remnants of Arlene fully merged into the larger extratropical system.[25]
Upon its formation as a subtropical depression on April 19, Arlene was the sixth known subtropical or tropical cyclone to form in the month of April in the Atlantic basin; the other instances were Ana in 2003, a subtropical storm in April 1992, and three tropical depressions in 1912, 1915, and 1973, respectively. When Arlene became a tropical storm on April 20, this marked only the second such occurrence on record, after Ana in 2003.[26][nb 2] Furthermore, it had the lowest central pressure of any Atlantic storm recorded in the month of April, with a central pressure of 990 mbar (hPa; 29.23 inHg), again surpassing Ana.[27] [28]Additionally, unrelated to Arlene, Tropical Storm Adrian in the Eastern Pacific basin also formed before the corresponding hurricane season was set to officially begin, being the earliest named storm in the Eastern Pacific proper. The last time where the first storms in both basins were pre-season storms was in 2012.[29]
Tropical Storm Bret[]
| Major tropical disturbance (HIHQ) | |
| Tropical storm (SSHWS) | |
  | |
| Duration | June 19 – June 20 |
|---|---|
| Peak intensity | 45 mph (75 km/h) (1-min) 1007 mbar (hPa) |
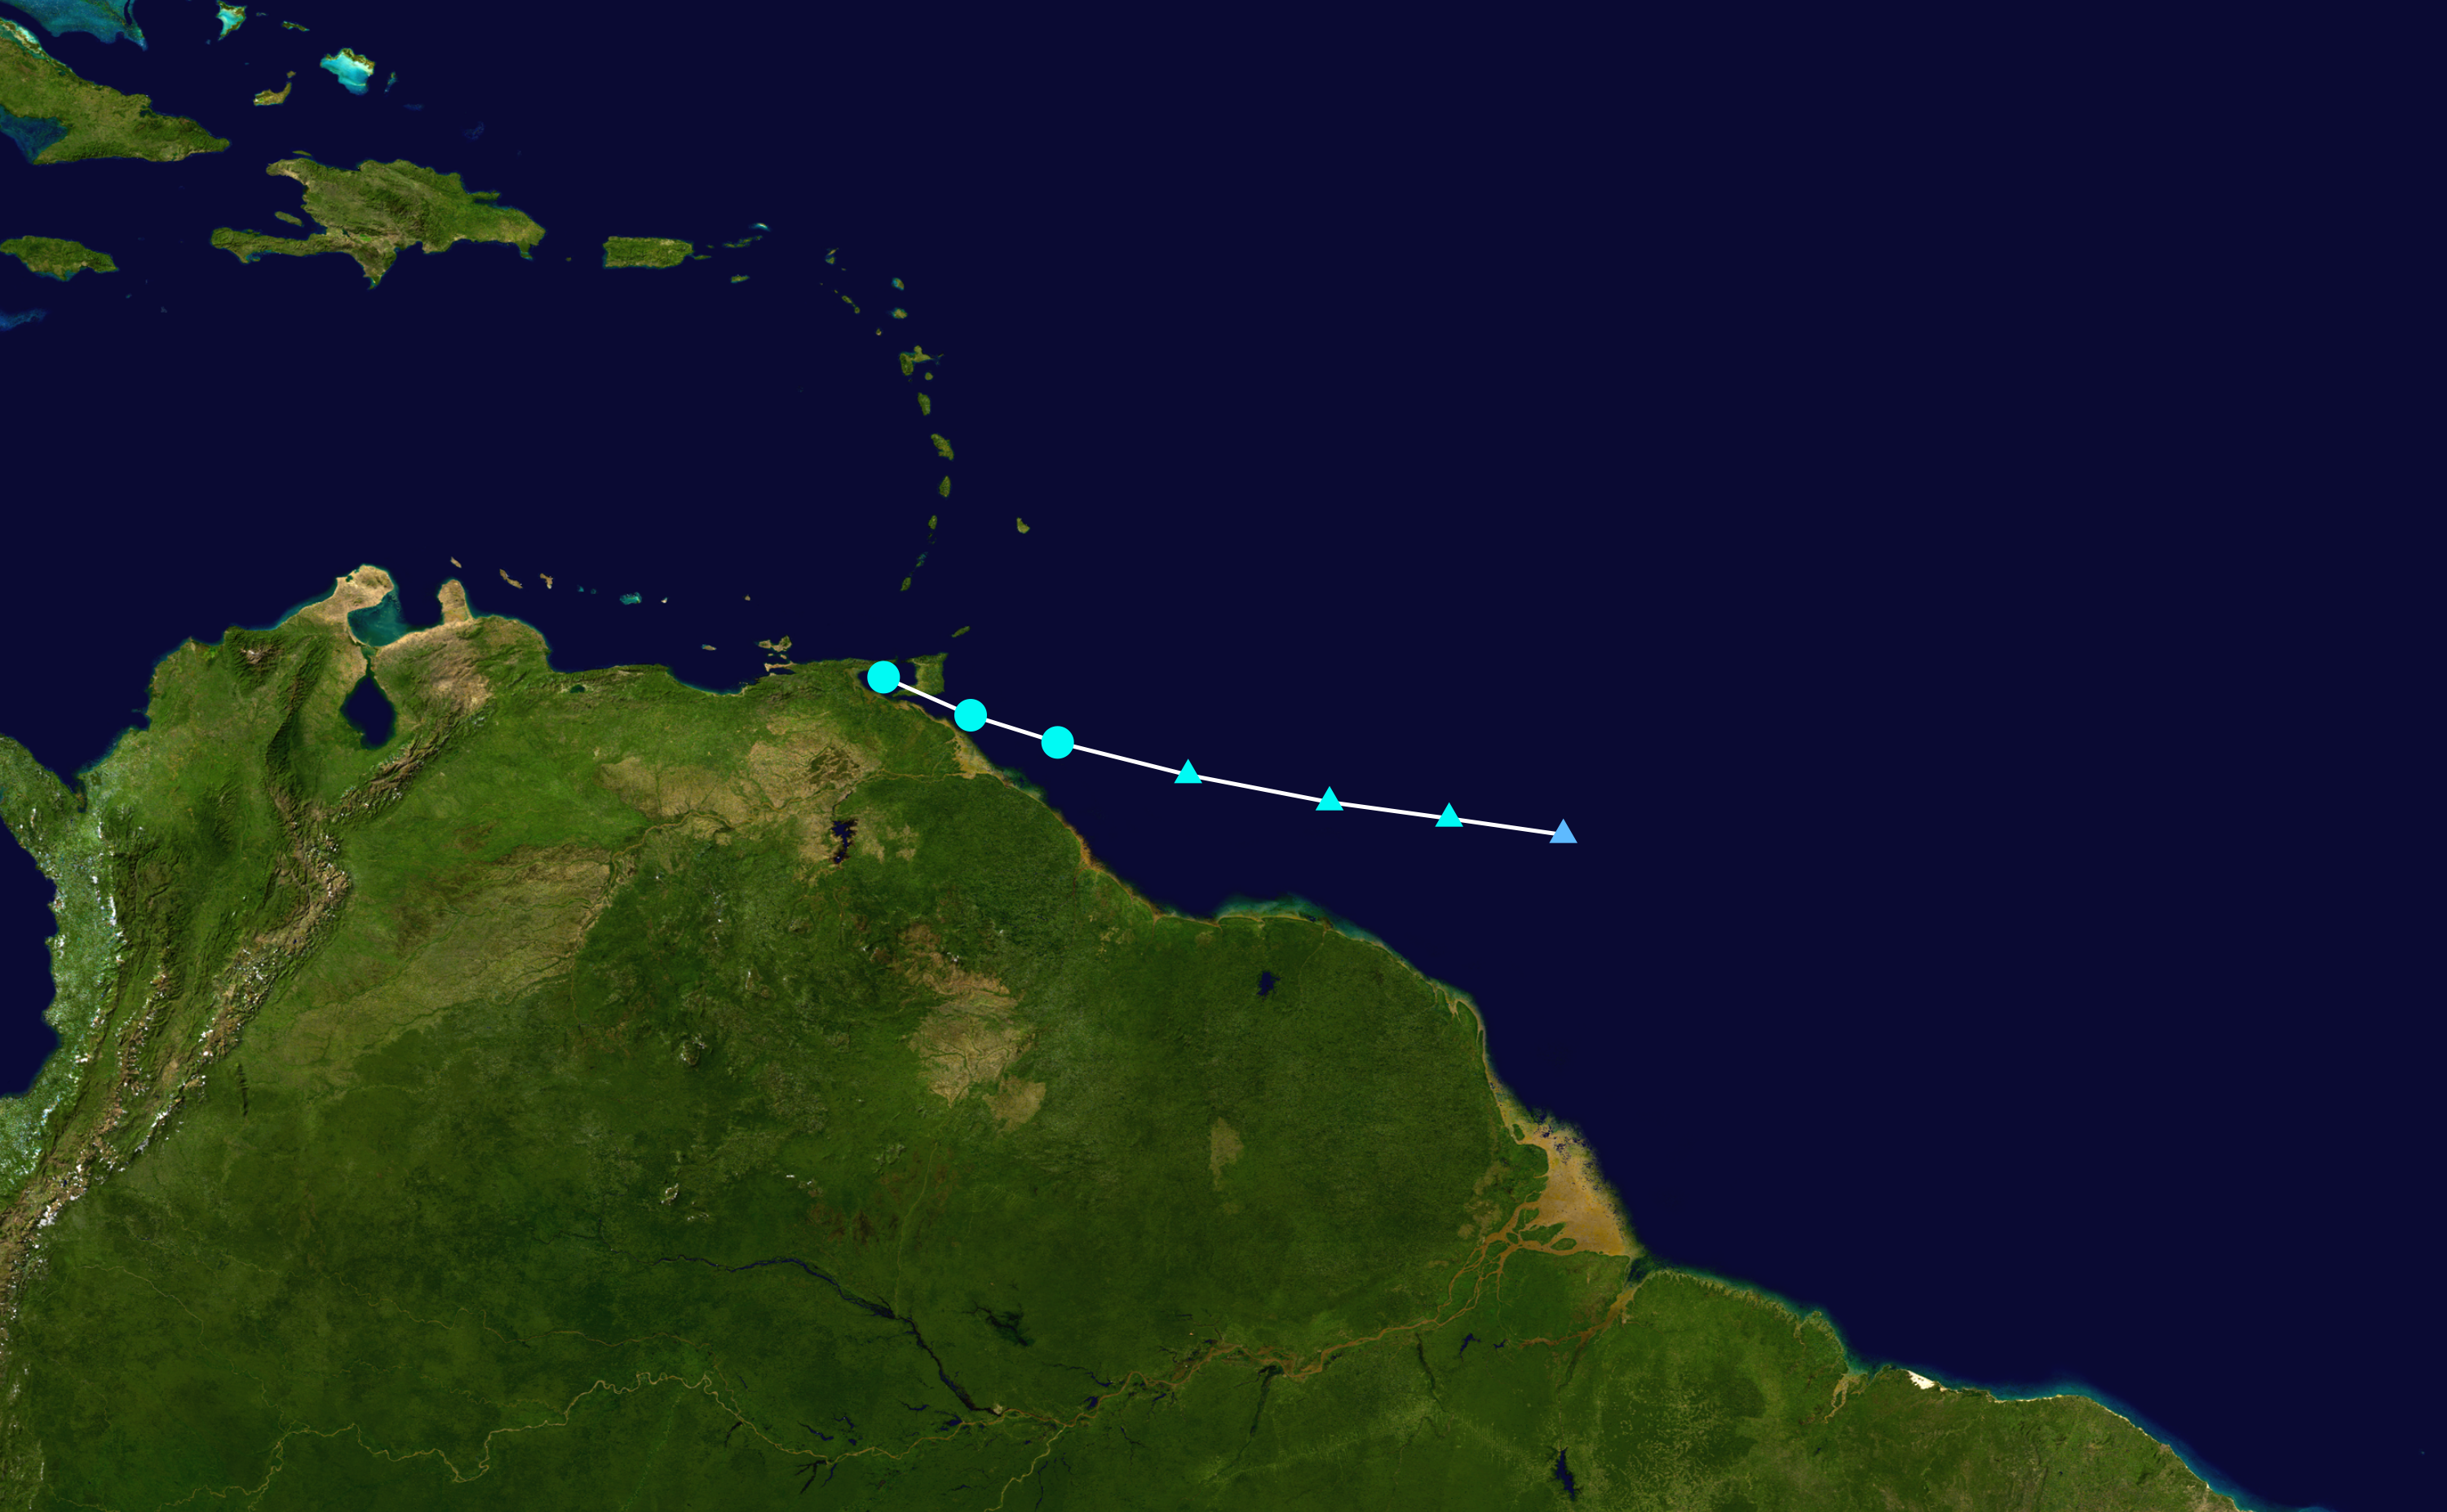
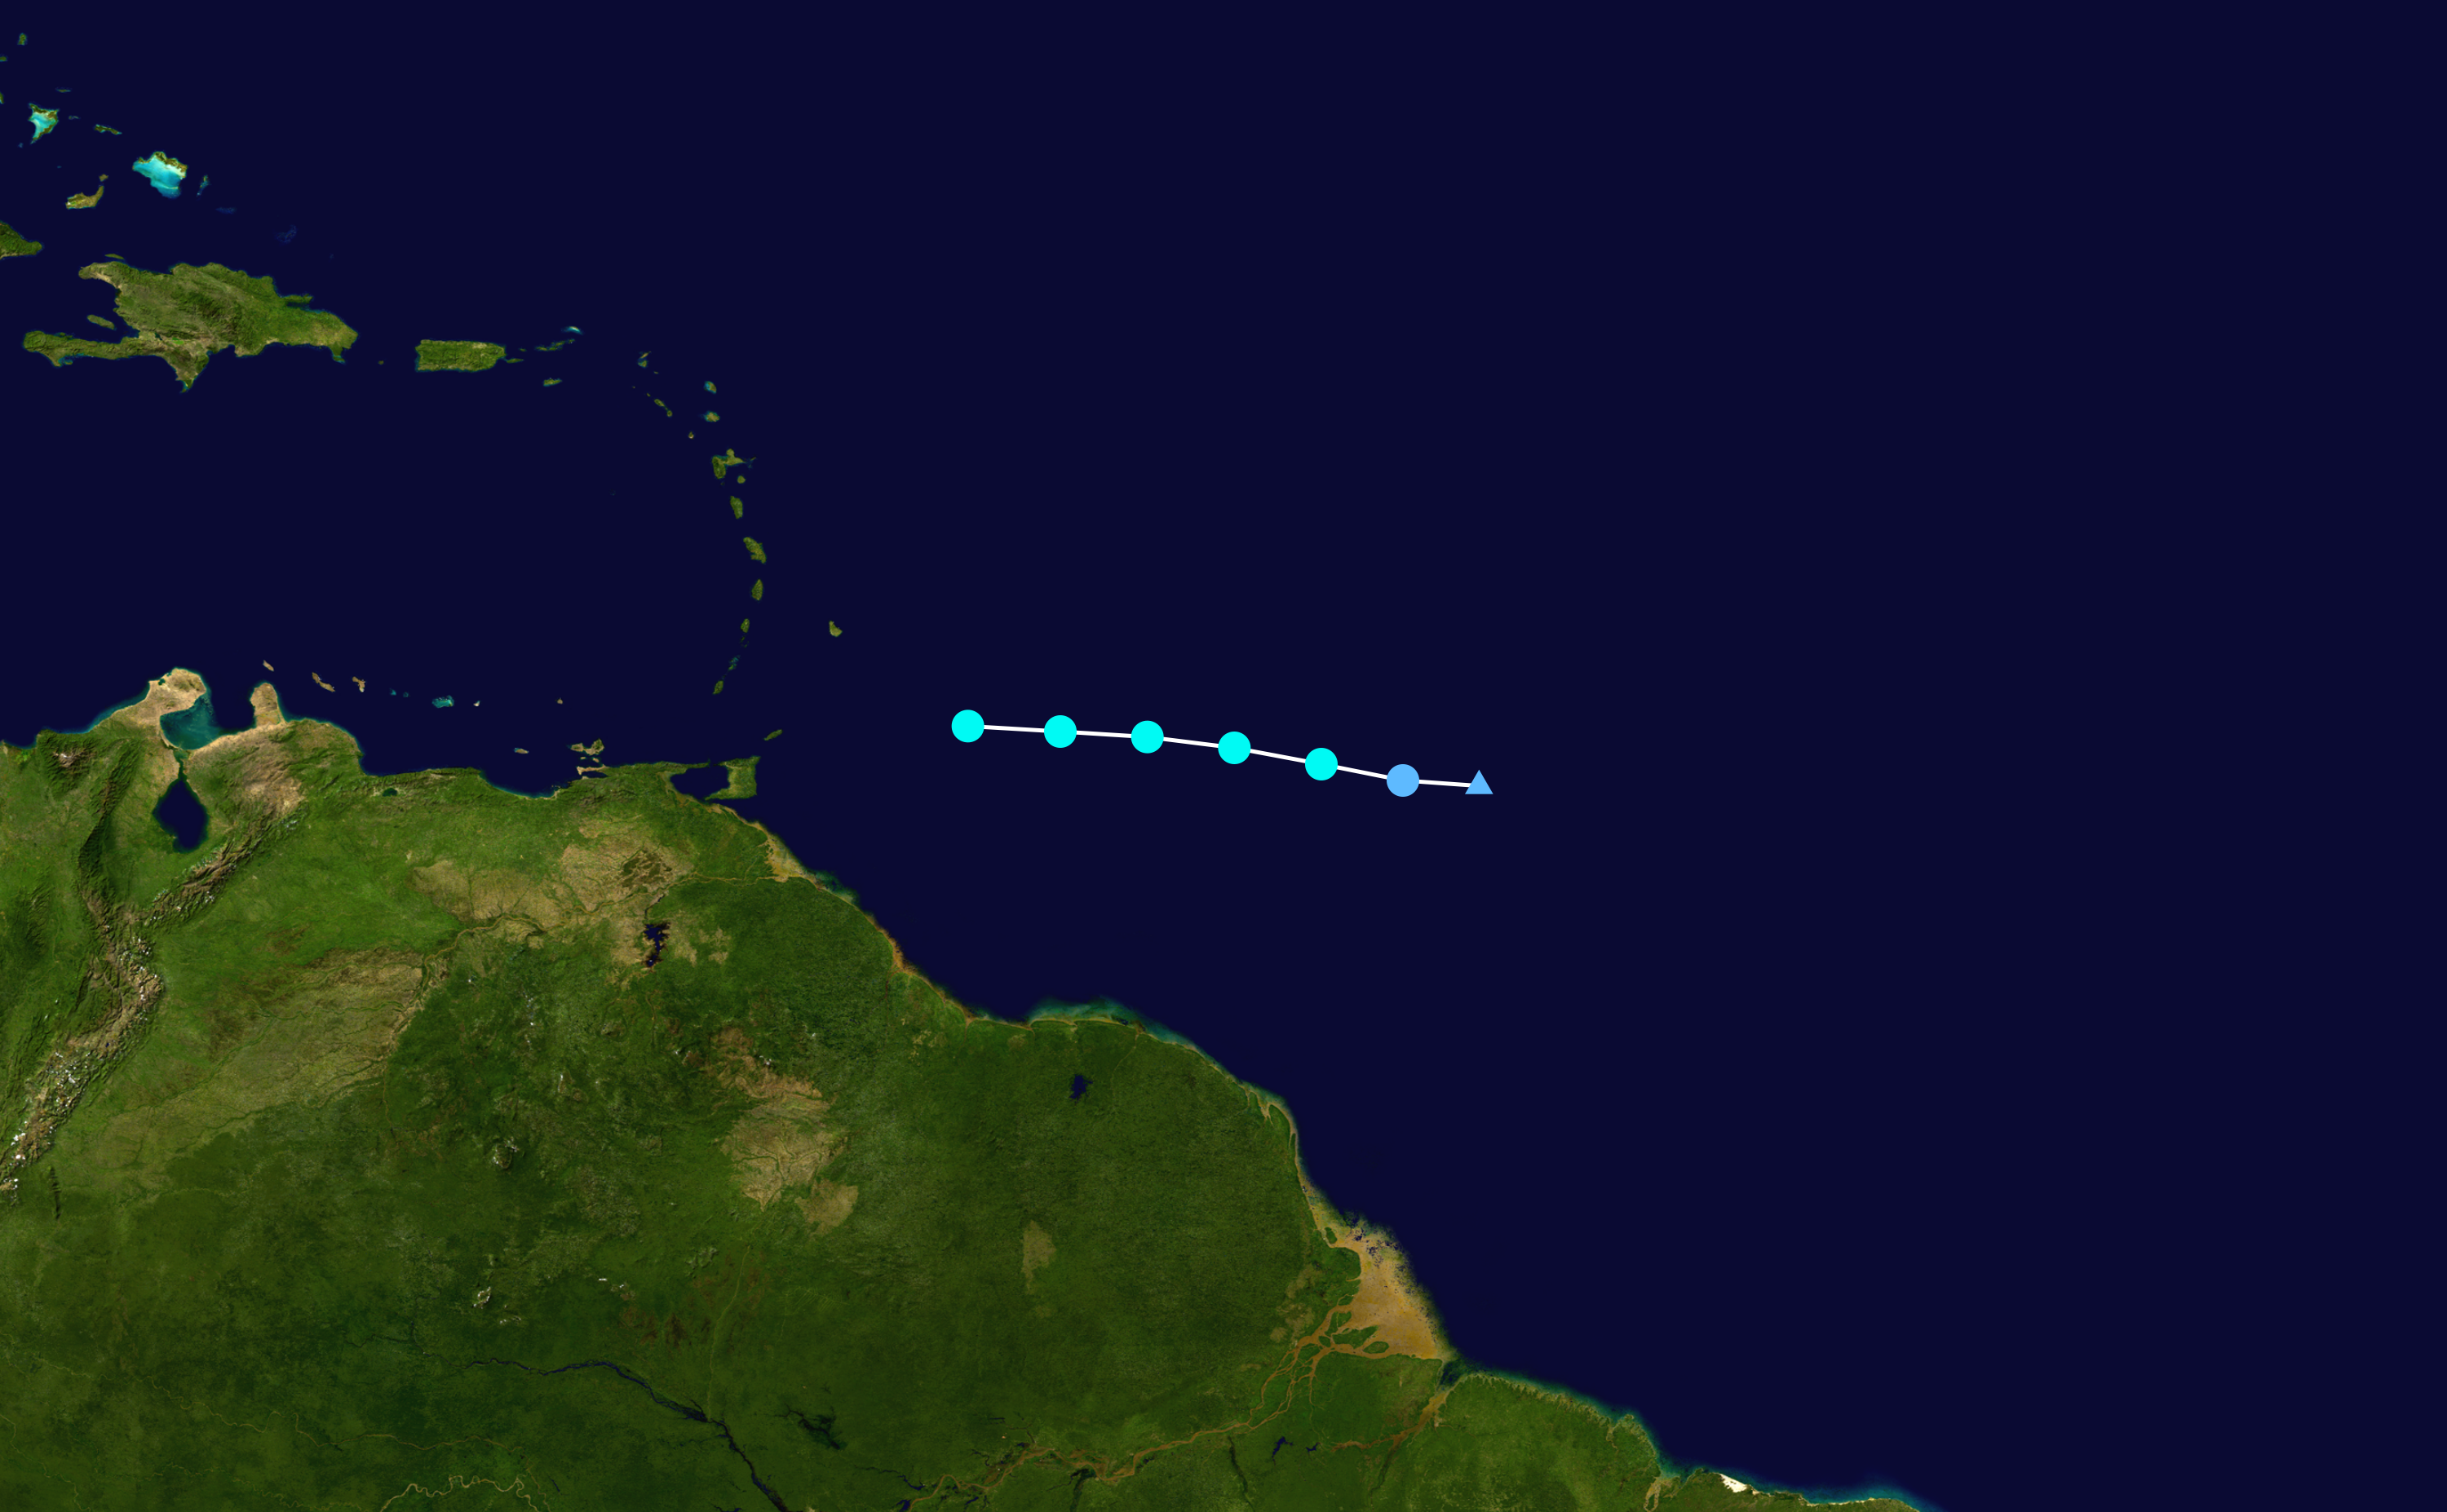
A tropical wave moved off the coast of Africa on June 13 and was first monitored by the National Hurricane Center shortly afterwards.[30] Development, however, was expected to be slow due to its low latitude and relatively fast motion. As it moved swiftly across the Main Development Region of the Atlantic Ocean, the disturbance began to gradually organize, and the NHC raised development chances slightly on June 16.[31]Little change in organization occurred until June 18, at which point a burst of convection near the center of the disturbance prompted the NHC to designate the system as Potential Tropical Cyclone Two at 21:00 UTC. This was the agency's first designation of a disturbance that had not yet developed into a tropical cyclone.[32] The storm continued to organize as it accelerated towards Venezuela and Trinidad and Tobago throughout the night, with banding features becoming evident. Later on June 19, the system developed a closed low-level circulation and was upgraded to Tropical Storm Bret at 21:00 UTC.[33] One day later, at 21:00 UTC on June 20, the last advisory on Bret was issued following its degeneration into a tropical wave.[34]
According to Phil Klotzbach of Colorado State University, Bret was the earliest storm to form in the Main Development Region on record, surpassing a record set by Tropical Storm Ana in 1979.[35] Bret was also the lowest latitude named storm in the month of June since 1933 at 9.4°N.[36] In Trinidad, one person died after he slipped and fell while running across a makeshift bridge; the fatality is considered indirectly related to Bret.[37][38] Another fatality occurred in Tobago after a man's house collapsed on him; he eventually succumbed to his injuries a week later.[39]
Tropical Storm Cindy[]
| Major tropical disturbance (HIHQ) | |
| Tropical storm (SSHWS) | |
  | |
| Duration | June 20 – June 23 |
|---|---|
| Peak intensity | 60 mph (95 km/h) (1-min) 992 mbar (hPa) |
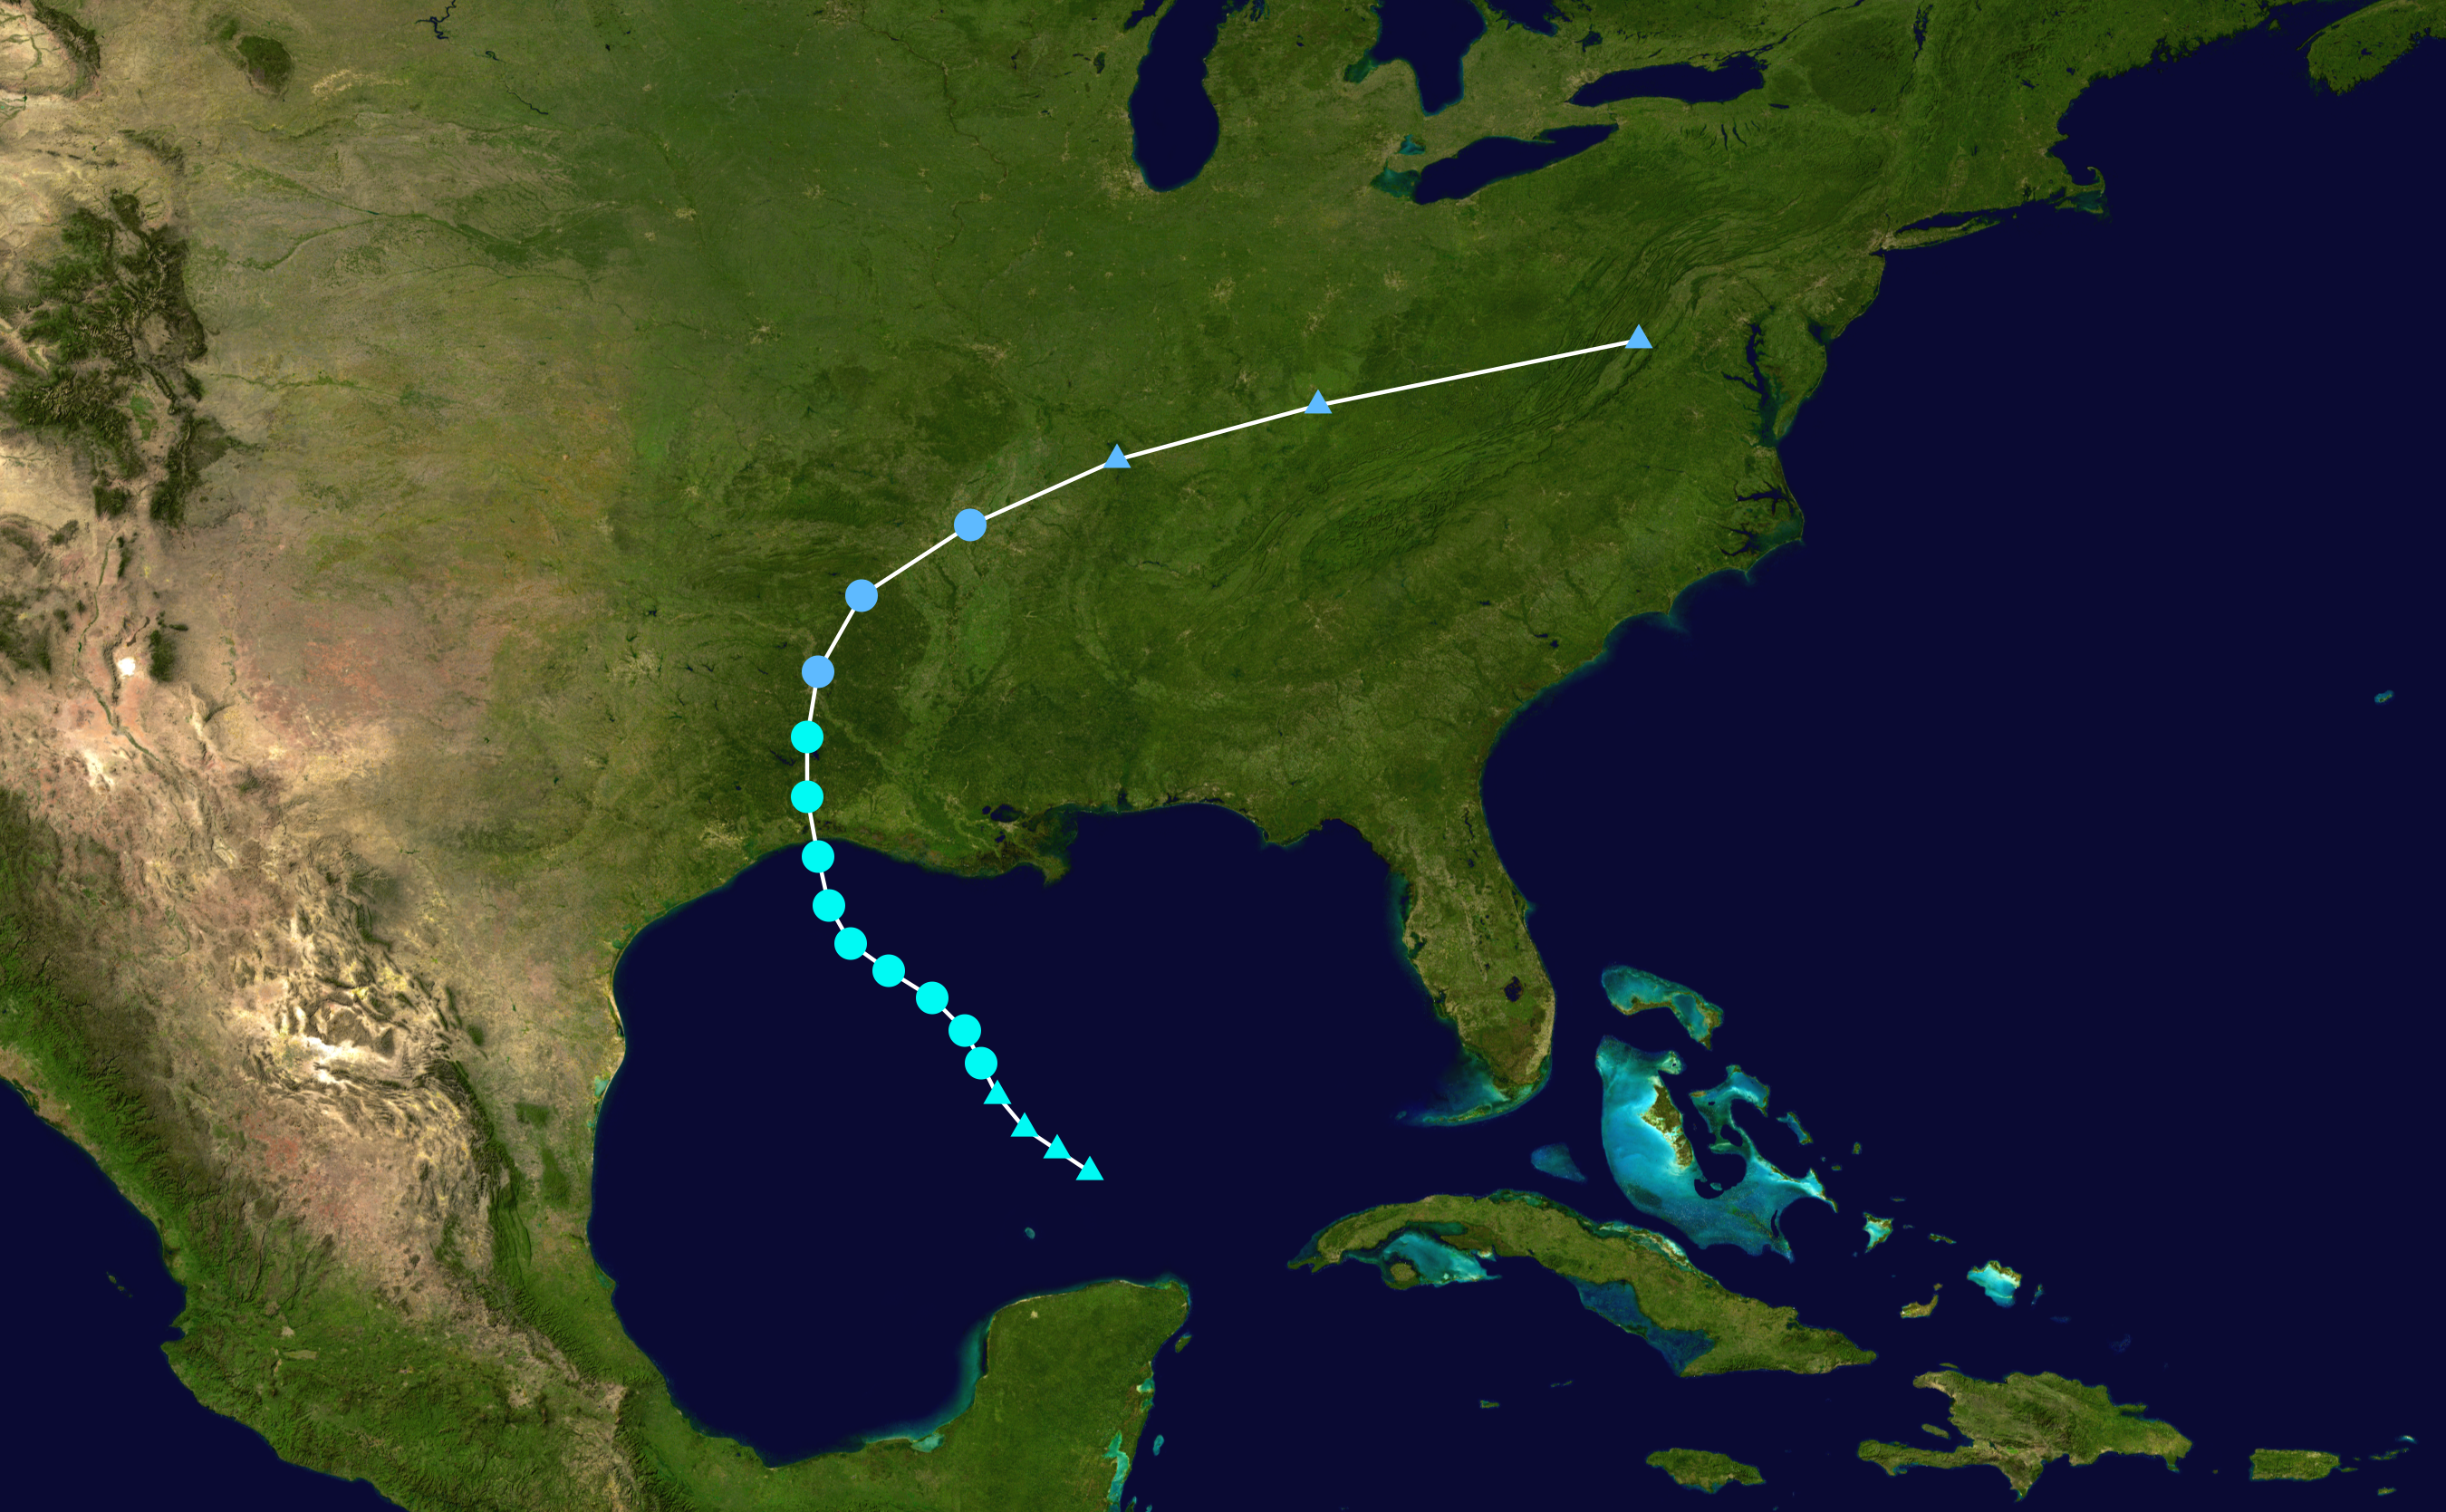
The NHC first began monitoring the potential for tropical cyclone formation over the northwestern Caribbean Sea on June 13.[40] A large area of disturbed weather developed within the region three days later,[41] and it slowly organized while entering the central Gulf of Mexico, prompting the NHC to begin advisories on a potential tropical cyclone on June 19. The structure of the system was initially sprawling, with tropical storm-force winds well displaced from a broad area of low pressure with embedded swirls.[42] A reconnaissance aircraft investigating the system around 18:00 UTC the following day was able to pinpoint a well-defined center, indicating the formation of Tropical Storm Cindy.[43] Despite the presence of dry air and strong wind shear, the cyclone still managed to attain peak winds of 60 mph (95 km/h) before weakening on approach to the Louisiana coastline.[44] It made landfall between Port Arthur, Texas and Cameron, Louisiana early on June 22 and weakened while progressing inland.[45]
A state of emergency was declared for Biloxi, Mississippi in anticipation of flooding. A ten-year-old boy died from injuries sustained during the storm in Fort Morgan, Alabama.[46] A second fatality later occurred in Bolivar Peninsula, Texas.[47]
Tropical Depression Four[]
| Minor tropical disturbance (HIHQ) | |
| Tropical depression (SSHWS) | |
  | |
| Duration | July 6 – July 7 |
|---|---|
| Peak intensity | 30 mph (45 km/h) (1-min) 1008 mbar (hPa) |
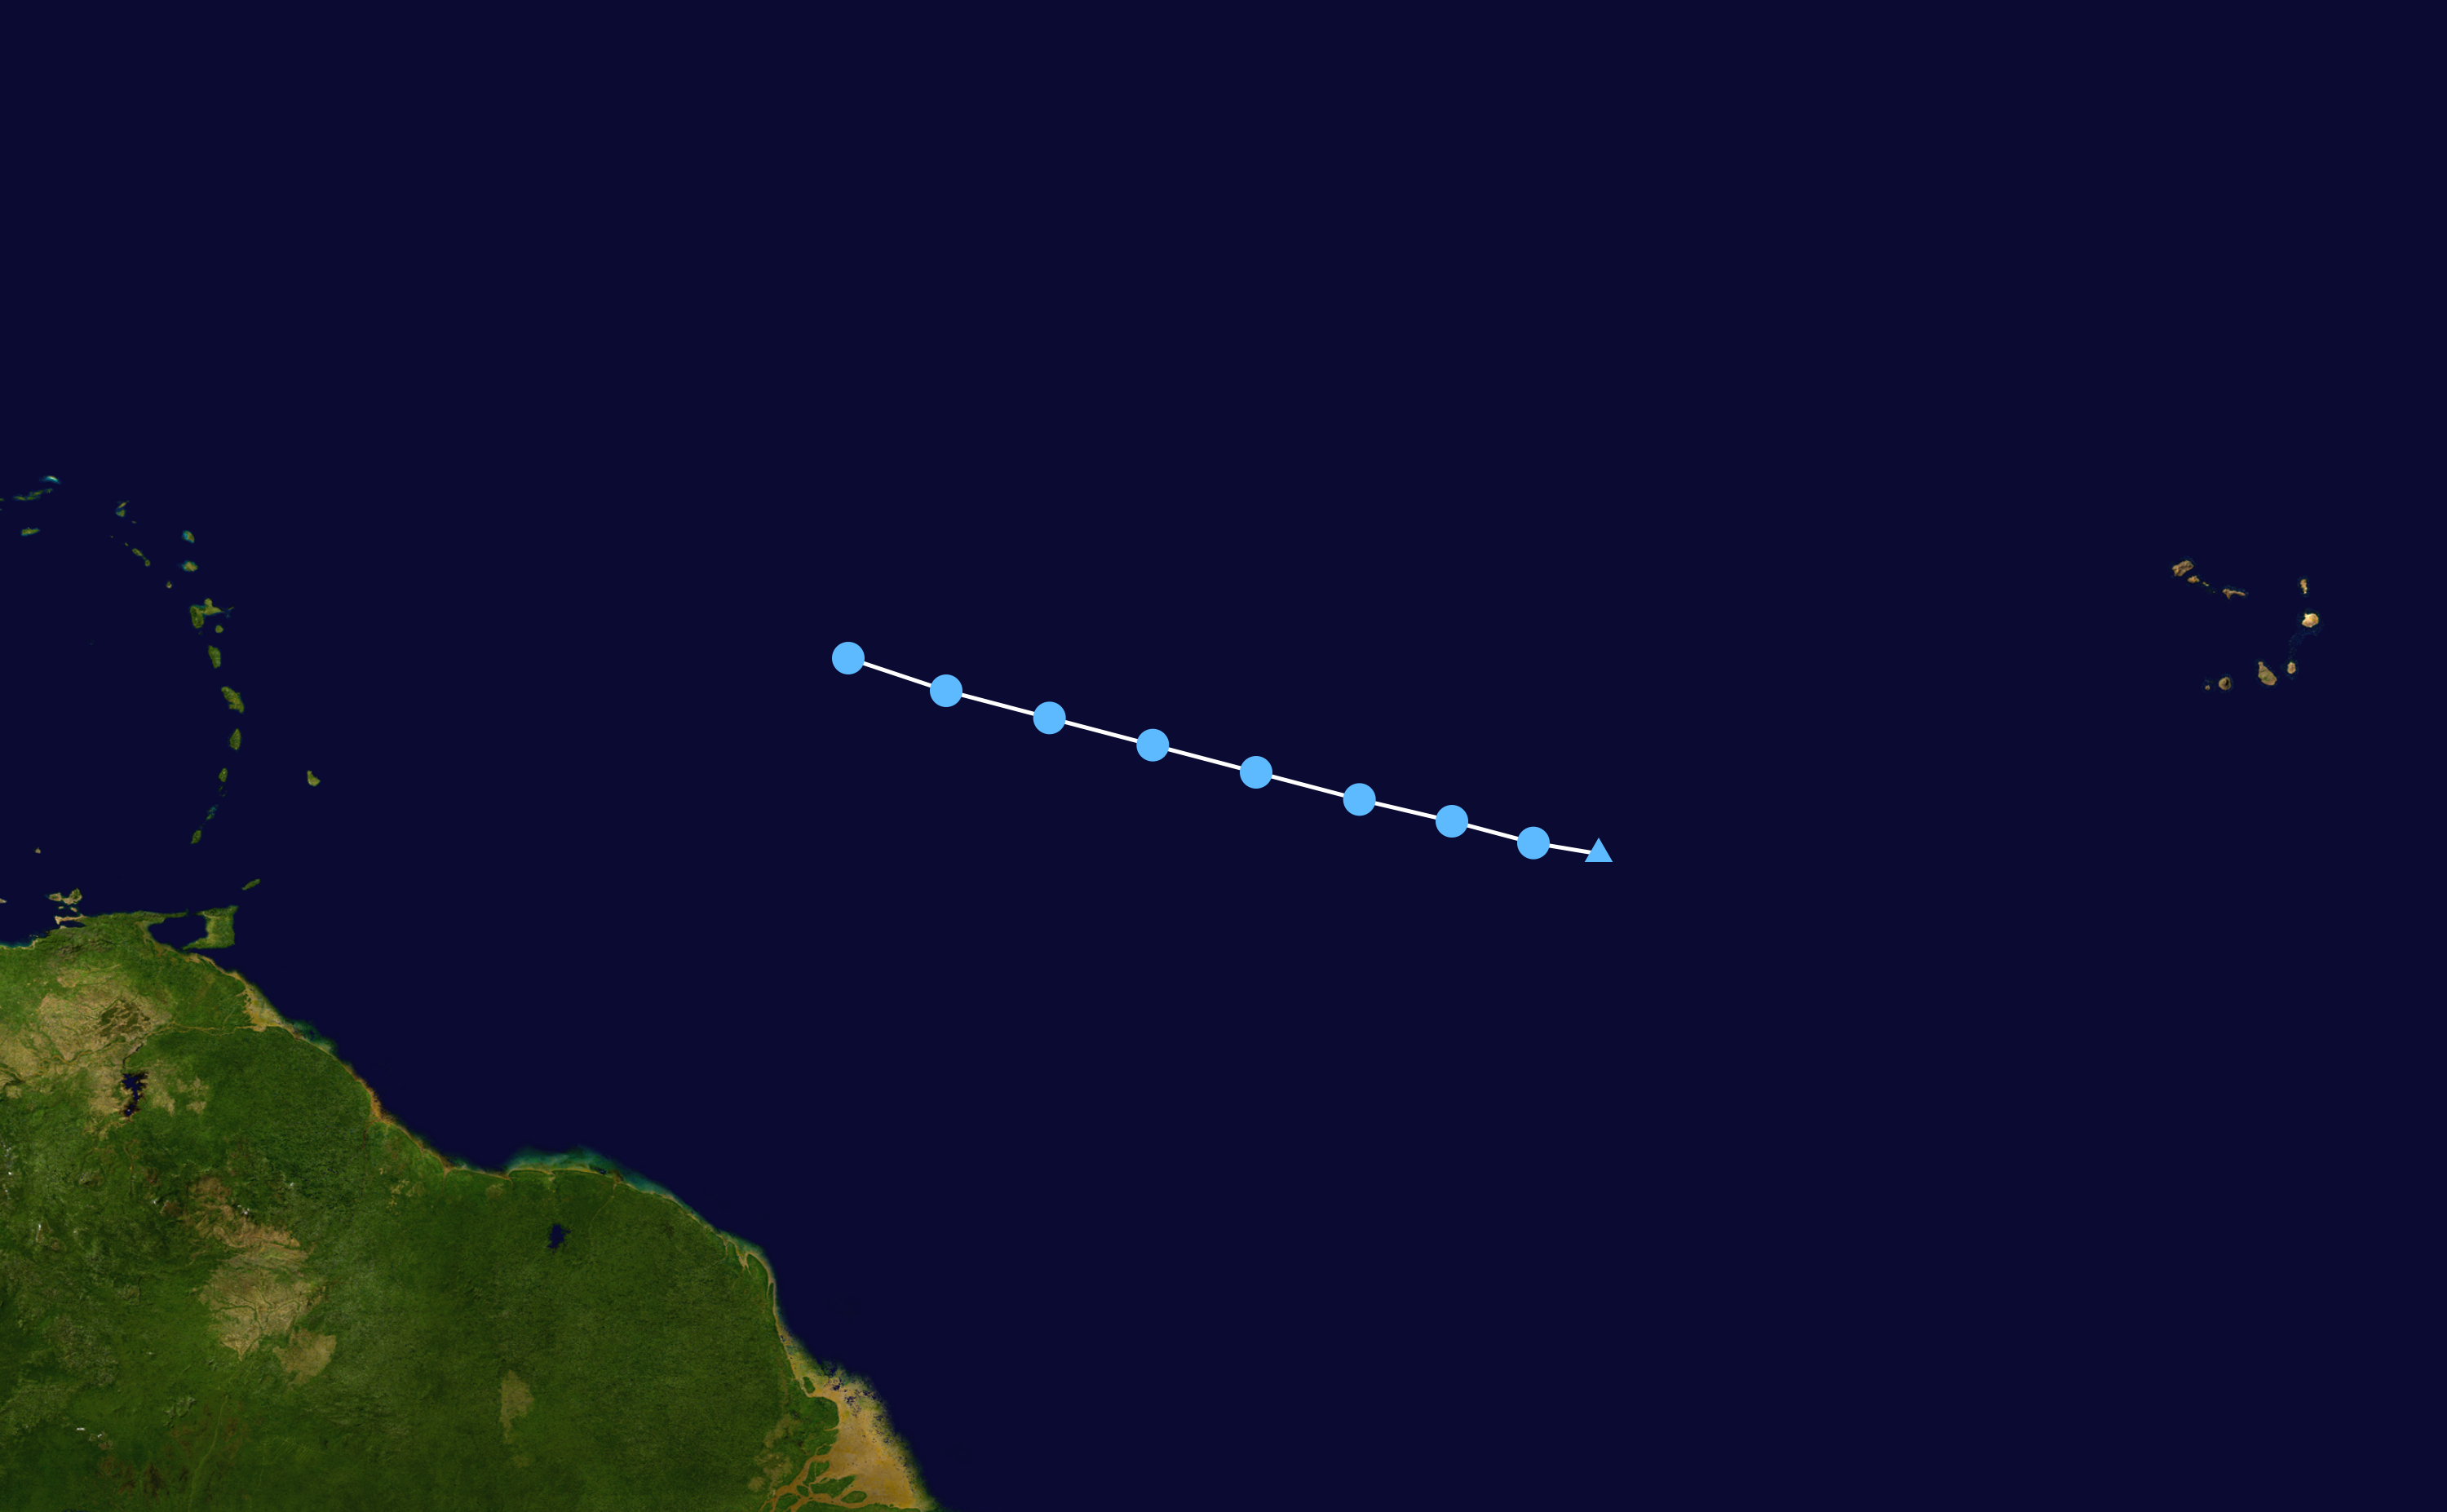
Early on June 29, the NHC began tracking a tropical wave embedded within a large envelope of deep moisture across the coastline of western Africa.[48] The disturbance was introduced as a potential contender for tropical cyclone formation two days later, as environmental conditions were expected to favor slow organization.[49] It began to show signs of organization over the central Atlantic early on July 3,[50] but the chances for development began to decrease two days later as the system moved toward a more stable environment.[51] Having already acquired a well-defined circulation, the development of a persistent mass of deep convection around 03:00 UTC the following day prompted the NHC to upgrade the wave to Tropical Depression Four, located about 1,545 miles (2,485 km) east of the Lesser Antilles.[52] Despite wind shear being low, the nascent depression struggled to intensify due to a dry environment caused by a Saharan Air Layer to its east, causing the low-level circulation to weaken, and resulting in the tropical depression degenerating into an open trough late the next day.[53]
Tropical Storm Don[]
| Major tropical disturbance (HIHQ) | |
| Tropical storm (SSHWS) | |
  | |
| Duration | July 17 – July 19 |
|---|---|
| Peak intensity | 50 mph (85 km/h) (1-min) 1007 mbar (hPa) |
Late on July 15, the NHC highlighted a low-pressure trough over the central Atlantic as having the potential to develop into a tropical cyclone.[54] The disturbance began to show signs of organization early on July 17,[55]and data from a reconnaissance aircraft investigating the system confirmed the development of Tropical Storm Don around 21:00 UTC that day.[56] The storm's overall appearance improved over subsequent hours until around 09:00 UTC, as a central dense overcast, accompanied by significant clusters of lightning, became pronounced.[57] Don attained its peak intensity at this time, characterised by winds of approximately 50 mph (85 km/h).[57] The next plane to investigate the cyclone a few hours later, however, found that the system's center had become less defined, and that sustained wind speeds had decreased to about 40 mph (65 km/h).[58] A combination of reconnaissance data and surface observations from the Windward Islands indicated that Don opened up into a tropical wave around 03:00 UTC on July 19 as it entered the eastern Caribbean Sea.[59]
Despite causing little impact, the storm name itself did generate a lot of attention from the media.
Tropical Depression Six[]
| Major tropical disturbance (HIHQ) | |
| Tropical depression (SSHWS) | |
  | |
| Duration | July 20 – July 21 |
|---|---|
| Peak intensity | 35 mph (55 km/h) (1-min) 1005 mbar (hPa) |
Early on July 20, the NHC began tracking a tropical wave coming off the coast of Africa. At around 21:00 UTC, it was upgraded to Tropical Depression Six as it began to move south towards South America. The storm began to move towards colder ocean water which allowed no further development. At 10:00 UTC, Six reached its peak strength at around 35 miles per hour.
At 16:00 UTC on July 21, Six made landfall in the British Virgin Islands. No fatalites were reported. Data from a reconnaissance flight shortly after Six exited landfall confirmed that the storm was gone.
Only a few buildings were severely damaged, nothing was destroyed.
Hurricane Emily[]
| Catastrophic tropical cyclone (HIHQ) | |
| Category 5 hurricane (SSHWS) | |
  | |
| Duration | July 23 – July 27 |
|---|---|
| Peak intensity | 165 mph (270 km/h) (1-min) 941 mbar (hPa) |
Late on July 22, the NHC began tracking a small disturbance in the Atlantic. At around 02:00 UTC, the storm was classified as Tropical Depression Seven. It later went through rapid intensification and later became Tropical Storm Emily. The very next day, it was upgraded to a major hurricane as it targeted the East Coast.
Emily caused major damage in North Carolina as a Category 4. It moved toward the District of Columbia as it weakened. On July 26, Emily hit the capital of the United States as a weak hurricane, causing minor damage.
16 people were killed during Emily. Many more were injured and even more left homeless. Emily caused around $2 million in damage.
Tropical Storm Franklin[]
| Major tropical disturbance (HIHQ) | |
| Tropical storm (SSHWS) | |
  | |
| Duration | July 23 – July 24 |
|---|---|
| Peak intensity | 60 mph (95 km/h) (1-min) 998 mbar (hPa) |
Tropical Storm Gert[]
| Minor tropical cyclone (HIHQ) | |
| Tropical storm (SSHWS) | |
  | |
| Duration | July 24 – July 26 |
|---|---|
| Peak intensity | 65 mph (100 km/h) (1-min) 991 mbar (hPa) |
Hurricane Harvey[]
| Minor tropical cyclone (HIHQ) | |
| Category 1 hurricane (SSHWS) | |
  | |
| Duration | July 26 – July 29 |
|---|---|
| Peak intensity | 80 mph (130 km/h) (1-min) 991 mbar (hPa) |
Hurricane Irma[]
| Extreme tropical cyclone (HIHQ) | |
| Category 4 hurricane (SSHWS) | |
 | |
| Duration | July 27 – August 2 |
|---|---|
| Peak intensity | 140 mph (220 km/h) (1-min) 951 mbar (hPa) |
Tropical Storm Jose[]
| Major tropical disturbance (HIHQ) | |
| Tropical storm (SSHWS) | |
 | |
| Duration | August 1 – August 3 |
|---|---|
| Peak intensity | 45 mph (75 km/h) (1-min) 1002 mbar (hPa) |
Hurricane Katia[]
| Minor tropical cyclone (HIHQ) | |
| Category 1 hurricane (SSHWS) | |
 | |
| Duration | August 3 – Ongoing |
|---|---|
| Peak intensity | 80 mph (130 km/h) (1-min) 991 mbar (hPa) |
Tropical Storm Lee[]
| Major tropical disturbance (HIHQ) | |
| Tropical storm (SSHWS) | |
| | |
| Duration | August 3 – August 4 |
|---|---|
| Peak intensity | 50 mph (85 km/h) (1-min) 1004 mbar (hPa) |
Tropical Storm Maria[]
| Major tropical disturbance (HIHQ) | |
| Tropical storm (SSHWS) | |
| | |
| Duration | August 4 – Ongoing |
|---|---|
| Peak intensity | 45 mph (75 km/h) (1-min) 1010 mbar (hPa) |
Tropical Storm Nate[]
| Major tropical disturbance (HIHQ) | |
| Tropical storm (SSHWS) | |
| | |
| Duration | August 4 – Ongoing |
|---|---|
| Peak intensity | 40 mph (65 km/h) (1-min) 1011 mbar (hPa) |
Tropical Depression Seventeen[]
| Minor tropical disturbance (HIHQ) | |
| Tropical depression (SSHWS) | |
| | |
| Duration | August 4 – Ongoing |
|---|---|
| Peak intensity | 30 mph (45 km/h) (1-min) 1013 mbar (hPa) |