The 2018–19 South Pacific cyclone season was a extremely active season that produced a 14 tropical cyclones, 7 of which became severe tropical cyclones. The season officially began on November 1, 2018 and ended on April 30, 2019; however, a tropical cyclone could form at any time between July 1, 2018 and June 30, 2019 and would count towards the season total. During the season, tropical cyclones were officially monitored by the Regional Specialized Meteorological Center (RSMC) in Nadi, Fiji and the Tropical Cyclone Warning Centers in Brisbane, Australia and Wellington, New Zealand. The United States Armed Forces through the Joint Typhoon Warning Center (JTWC) also monitored the basin and issued unofficial warnings for American interests. RSMC Nadi attaches a number and an F suffix to tropical disturbances that form in or move into the basin while the JTWC designates significant tropical cyclones with a number and a P suffix. RSMC Nadi, TCWC Wellington and TCWC Brisbane all use the Australian Tropical Cyclone Intensity Scale and estimate windspeeds over a period of ten minutes, while the JTWC estimates sustained winds over a 1-minute period, which are subsequently compared to the Saffir–Simpson hurricane wind scale (SSHWS).
Seasonal forecasts[]
| Source/Record | Tropical Cyclone | Severe Tropical Cyclone |
|---|---|---|
| Record high: | 1997–98: 16 | 1982–83: 10 |
| Record low: | 2011–12: 3 | 2008–09: 0 |
| Average (1969-70 - 2016-17): | 7.1 | — |
| NIWA October | 14-18 | 6-8 |
| Fiji Meteorological Service | 12-14 | 3-5 |
| Region | Chance of above average |
Average number |
| Western South Pacific | 90% | 7 |
| Eastern South Pacific | 95% | 4 |
Ahead of the cyclone season, the Fiji Meteorological Service (FMS), Australian Bureau of Meteorology (BoM), New Zealand's MetService and National Institute of Water and Atmospheric Research (NIWA) and various other Pacific Meteorological services, all contributed towards the Island Climate Update tropical cyclone outlook that was released during October 2018.The outlook took into account the extremely strong El Niño 3.4.The outlook called for a above number of tropical cyclones for the 2018–19 season, with twelve to eighteen named tropical cyclones, to occur between 135°E and 120°W compared to an average of about 10.At least six of the tropical cyclones were expected to become Category 3 severe tropical cyclones, while four could become Category 4 severe tropical cyclones; they also noted that a Category 5 severe tropical cyclone was very likely to occur during the season.
In addition to contributing towards the Island Climate Update outlook, the FMS and the BoM issued their own seasonal forecasts for the South Pacific region. The BoM issued two seasonal forecasts for the Southern Pacific Ocean, for their self-defined eastern and western regions of the South Pacific Ocean.They predicted that the Western region between 142.5°E and 165°E, had a 90% chance of seeing activity above its average of 7 tropical cyclones. The BoM also predicted that the Eastern Region between 165°E and 120°W, had a 95% chance of seeing activity above its average of 4 tropical cyclones. Within their outlook the FMS predicted that between four and six tropical cyclones, would occur within the basin compared to an average of around 7.1 cyclones.At least one of the tropical cyclones was expected to intensify into a Category 3 or higher severe tropical cyclone. They also predicted that the main area for tropical cyclogenesis would be within the Coral Sea, to the west of the International Dateline.
Both the Island Climate Update and the FMS tropical cyclone outlooks assessed the risk of a tropical cyclone affecting a certain island or territory.The Island Climate Update Outlook predicted that New Caledonia, Tonga, New Zealand and Papua New Guinea had an above average chance of being impacted by a tropical cyclone or the. They also predicted that the Solomon Islands, Fiji and Vanuatu had a above normal risk of being impacted by one or more tropical cyclones. The Southern Cook Islands, American Samoa, Samoa, Niue, Tokelau, Tuvalu, as well as Wallis and Futuna were thought to have a below average chance of being impacted. It was also considered very likely that the Northern Cook Islands, French Polynesia, Kiribati and the Pitcairn Islands would be affected by a tropical cyclone.The FMS's outlook predicted that Vanuatu, New Caledonia, Fiji as well as Wallis and Futuna had a normal chance of being impacted by a tropical cyclone.The outlook also predicted that the Solomon Islands, Tokelau, Samoa, Tonga, Niue, Cook Islands and French Polynesia had a hight chance of being affected by a tropical cyclone. It was thought that there was a hight risk of Vanuatu, New Caledonia, Fiji and Samoa being impacted by at least one severe tropical cyclone, while other areas such as the Solomon Islands, Tokelau, Samoa, Tonga, Niue and French Polynesia, had a medium chance of being impacted by a severe tropical cyclone.
Timeline[]

The 2018–19 season was one of the most active and longest South Pacific tropical cyclone seasons on record, with 14 tropical cyclones occurring within the South Pacific basin between 160°E and 120°W. The season was characterised by a very strong 3.4 El Niño event, which resulted in eleven tropical cyclones occurring to the east of the International Dateline. some of these tropical cyclones went on to affect the island nation of French Polynesia, which it was thought had not been affected by a tropical cyclone since another very strong El Nino episode in 1905-06. During the season, seven of the fourteen tropical cyclones observed to the east of 160 E were severe tropical cyclones.After the season had officially ended during April 30, some meteorologists identified a subtropical depression developed from May 2 to May 5. The tropical depression that developed during May 11 was thought to be the easternmost forming South Pacific tropical cyclone ever observed in the satellite era, as it developed near 130°W.
Storms[]
Tropical Cyclone Amos[]
| Category 2 tropical cyclone (Australian scale) | |
| Tropical storm (SSHWS) | |
  | |
| Duration | June 2 – June 6 |
|---|---|
| Peak intensity | 95 km/h (60 mph) (10-min) 988 hPa (mbar) |
Tropical Depression 04F[]
| Tropical depression (Australian scale) | |
| Tropical depression (SSHWS) | |
  | |
| Duration | August 7 – August 10 |
|---|---|
| Peak intensity | 55 km/h (35 mph) (10-min) 1005 hPa (mbar) |
Severe Tropical Cyclone Bart[]
| Category 3 severe tropical cyclone (Australian scale) | |
| Category 1 tropical cyclone (SSHWS) | |
  | |
| Duration | September 14 – September 20 |
|---|---|
| Peak intensity | 120 km/h (75 mph) (10-min) 980 hPa (mbar) |
Tropical Depression 12F[]
| Tropical depression (Australian scale) | |
| Tropical depression (SSHWS) | |
  | |
| Duration | October 5 – October 12 |
|---|---|
| Peak intensity | 55 km/h (35 mph) (10-min) 998 hPa (mbar) |
Tropical Cyclone Cook[]
| Category 3 severe tropical cyclone (Australian scale) | |
| Category 2 tropical cyclone (SSHWS) | |
  | |
| Duration | October 7 – October 21 |
|---|---|
| Peak intensity | 140 km/h (85 mph) (10-min) 971 hPa (mbar) |
Tropical Cyclone Donna[]
| Category 3 severe tropical cyclone (Australian scale) | |
| Category 1 tropical cyclone (SSHWS) | |
  | |
| Duration | October 28 – November 2 |
|---|---|
| Peak intensity | 120 km/h (75 mph) (10-min) 970 hPa (mbar) |
Severe Tropical Cyclone Ella[]
| Category 5 severe tropical cyclone (Australian scale) | |
| Category 5 tropical cyclone (SSHWS) | |
  | |
| Duration | November 1 – November 24 |
|---|---|
| Peak intensity | 230 km/h (145 mph) (10-min) 908 hPa (mbar) |
Severe Tropical Cyclone Fehi[]
| Category 4 severe tropical cyclone (Australian scale) | |
| Category 4 tropical cyclone (SSHWS) | |
  | |
| Duration | November 13 – November 21 |
|---|---|
| Peak intensity | 175 km/h (110 mph) (10-min) 932 hPa (mbar) |
Severe Tropical Cyclone Gita[]
| Category 5 severe tropical cyclone (Australian scale) | |
| Category 4 tropical cyclone (SSHWS) | |
  | |
| Duration | November 22 – December 4 |
|---|---|
| Peak intensity | 205 km/h (125 mph) (10-min) 917 hPa (mbar) |
Tropical Cyclone Hola[]
| Category 1 tropical cyclone (Australian scale) | |
| Tropical storm (SSHWS) | |
  | |
| Duration | December 8 – December 11 |
|---|---|
| Peak intensity | 85 km/h (50 mph) (10-min) 990 hPa (mbar) |
Tropical Low 20F[]
| Tropical depression (Australian scale) | |
| Tropical storm (SSHWS) | |
  | |
| Duration | December 24 – December 28 |
|---|---|
| Peak intensity | 55 km/h (35 mph) (10-min) 1002 hPa (mbar) |
Tropical Depression 21F[]
| Tropical depression (Australian scale) | |
| Tropical depression (SSHWS) | |
  | |
| Duration | January 1 – January 2 |
|---|---|
| Peak intensity | 45 km/h (30 mph) (10-min) 1007 hPa (mbar) |
Tropical Depression 24F[]
| Tropical depression (Australian scale) | |
| Tropical storm (SSHWS) | |
  | |
| Duration | January 10 – January 13 |
|---|---|
| Peak intensity | 55 km/h (35 mph) (10-min) 993 hPa (mbar) |
Severe Tropical Cyclone Iris[]
| Category 4 severe tropical cyclone (Australian scale) | |
| Category 4 tropical cyclone (SSHWS) | |
  | |
| Duration | January 20 – January 26 |
|---|---|
| Peak intensity | 175 km/h (110 mph) (10-min) 940 hPa (mbar) |
Severe Tropical Cyclone Josie[]
| Category 5 severe tropical cyclone (Australian scale) | |
| Category 5 tropical cyclone (SSHWS) | |
  | |
| Duration | January 30 – February 13 |
|---|---|
| Peak intensity | 280 km/h (175 mph) (10-min) 896 hPa (mbar) |
Tropical Cyclone Keni[]
| Category 1 tropical cyclone (Australian scale) | |
| Tropical storm (SSHWS) | |
  | |
| Duration | February 3 – February 5 |
|---|---|
| Peak intensity | 85 km/h (50 mph) (10-min) 995 hPa (mbar) |
Tropical Depression 30F[]
| Tropical depression (Australian scale) | |
| Tropical storm (SSHWS) | |
  | |
| Duration | February 9 – February 11 |
|---|---|
| Peak intensity | 55 km/h (35 mph) (10-min) 1002 hPa (mbar) |
Tropical Depression 32F[]
| Tropical depression (Australian scale) | |
| Tropical storm (SSHWS) | |
  | |
| Duration | February 14 – February 17 |
|---|---|
| Peak intensity | 55 km/h (35 mph) (10-min) 993 hPa (mbar) |
Severe Tropical Cyclone Liua[]
| Category 3 severe tropical cyclone (Australian scale) | |
| Category 2 tropical cyclone (SSHWS) | |
  | |
| Duration | February 20 – February 25 |
|---|---|
| Peak intensity | 155 km/h (100 mph) (10-min) 958 hPa (mbar) |
Severe Tropical Cyclone Mona[]
| Category 5 severe tropical cyclone (Australian scale) | |
| Category 5 tropical cyclone (SSHWS) | |
  | |
| Duration | March 1 – March 15 |
|---|---|
| Peak intensity | 295 km/h (185 mph) (10-min) 888 hPa (mbar) |
Tropical Cyclone Neil[]
| Category 1 tropical cyclone (Australian scale) | |
| Tropical storm (SSHWS) | |
  | |
| Duration | April 3 – April 5 |
|---|---|
| Peak intensity | 85 km/h (50 mph) (10-min) 995 hPa (mbar) |
Tropical Depression 38F[]
| Tropical depression (Australian scale) | |
| Tropical storm (SSHWS) | |
  | |
| Duration | April 27 – April 29 |
|---|---|
| Peak intensity | 55 km/h (35 mph) (10-min) 1002 hPa (mbar) |
Storm names[]
- See also: Lists of tropical cyclone names
Within the Southern Pacific a tropical depression is judged to have reached tropical cyclone intensity should it reach winds of 65 km/h, (40 mph) and it is evident that gales are occurring at least halfway around the center. With tropical depressions intensifying into a tropical cyclone between the Equator and 25°S and between 160°E - 120°W named by the RSMC Nadi. However should a tropical depression intensify to the south of 25°S between 160°E and 120°W it will be named in conjunction with RSMC Nadi by TCWC Wellington. Should a tropical cyclone move out of the basin and into the Australian region it will retain its original name. The next names on the naming list are listed below.
|
|
|
|
|
Season effects[]
| Storm name |
Dates active | Storm category at peak intensity |
Max 1-min wind mph (km/h) |
Min. press. (mbar) |
Areas affected | Damage (USD) |
Deaths | |||
|---|---|---|---|---|---|---|---|---|---|---|
| Amos | June 2 – June 6 | Tropical storm | 60 | 988 | None | None | None | |||
| 04F | August 7 – August 10 | Tropical depression | 35 | 1005 | None | None | None | |||
| Bart | September 14 – September 20 | Category 1 hurricane | 75 | 980 | Samoa | $5 million | None | |||
| 12F | October 5 – October 12 | Tropical depression | 35 | 998 | American Samoa | Minimal | None | |||
| Cook | October 7- October 21 | Category 2 hurricane | 85 | 971 | Fiji archipelago | $78 million | 12 | |||
| Donna | October 28- November 2 | Category 1 hurricane | 75 | 970 | New Caledonia | Unknow | 1 | |||
| Ella | November 1– November 24 | Category 5 hurricane | 145 | 908 | Fiji archipelago,Vanuatu,
New Zealand |
$1000 million | 58 | |||
| Fehi | November 13- November 21 | Category 4 hurricane | 110 | 932 | Vanuatu | Minimal | (2) | |||
| Gita | November 22- December 4 | Category 4 hurricane | 125 | 917 | Vanuatu,Fiji
archipelago |
$17.6 million | 2 | |||
| Hola | December 8– December 11 | Tropical storm | 50 | 990 | None | None | None | |||
| 20F | December 24- December 28 | Tropical storm | 35 | 1002 | None | None | None | |||
| 21F | January 1- January 2 | Tropical depression | 30 | 1007 | None | None | None | |||
| 24F | January 10– January 13 | Tropical storm | 35 | 993 | New Caledonia | Minimal | None | |||
| Iris | January 20- January 26 | Category 4 hurricane | 110 | 940 | Vanuatu | Minimal | 2 | |||
| Joshie | January 30– February 13 | Category 5 hurricane | 175 | 896 | None | $100 million | 12 | |||
| Keni | February 3- February 5 | Tropical storm | 50 | 995 | None | None | None | |||
| 30F | February 9- February 11 | Tropical storm | 35 | 1002 | Vanuatu | $25 million | 4 | |||
| 32F | February 14– February 17 | Tropical storm | 35 | 993 | None | None | None | |||
| Liua | February 20- February 25 | Category 2 hurricane | 100 | 958 | None | None | None | |||
| Mona | March 1- March 15 | Category 5 hurricane | 185 | 888 | None | None | None | |||
| Neil | April 3– April 5 | Tropical storm | 50 | 995 | None | None | None | |||
| 38F | April 27- April 29 | Tropical storm | 35 | 1002 | None | None | None | |||
| Season aggregates | ||||||||||
| 14 systems | June 2 – April 29 | 185 | 888 | Nearly entire south pacific islands | $3 billion | 120 | ||||
Other Systems[]
On January 29, the JTWC issued a tropical cyclone formation alert on a tropical disturbance, which was located near the Vanuatu Islands The system had a well defined low-level circulation, and was located within an area of warm sea surface temperatures and marginal vertical wind shear.Being named with the BOM instead of the RSMC,the name was Trevor,the system exited basin some days later.
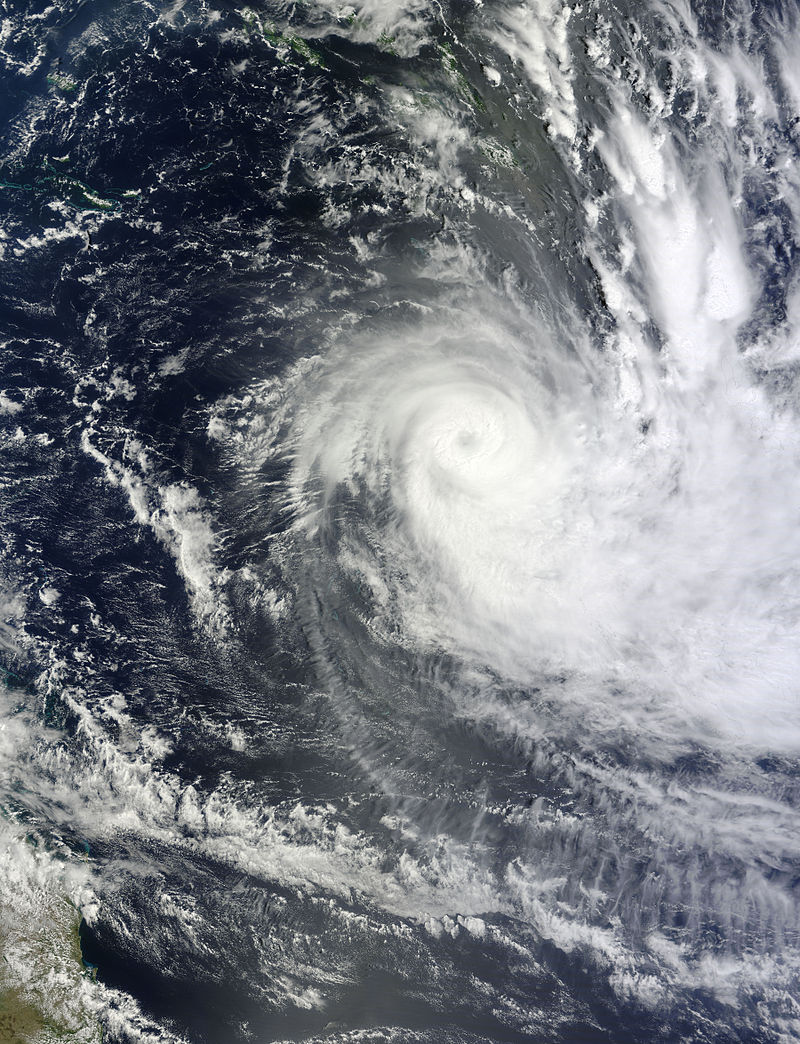
Chilean subtropical storm[]


On May 2, 2018, a system potentially classified as a subtropical cyclone formed east of 120°W, just a few hundred miles off the coast of Chile. The cyclone formed in an area without a Regional Specialized Meteorological Center, so it was not officially classified.On May 4, the satellite services division of the NOAA classified the system as a subtropical storm with a symmetric eye,transitioning in tropical depression near land despite occurring in cooler (below 20 °C) sea surface temperatures.

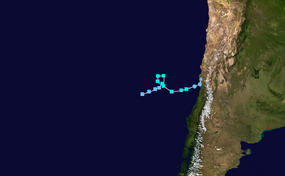
Map plotting the storm's track and intensity, according to the Saffir–Simpson scale
Tropical storm (39–54 mph, 63–87 km/h)
Category 1 (74–95 mph, 119–153 km/h)
Category 2 (96–110 mph, 154–177 km/h)
Category 3 (111–129 mph, 178–208 km/h)
Category 4 (130–156 mph, 209–251 km/h)
Category 5 (≥157 mph, ≥252 km/h)