The 2055 Atlantic hurricane season was the most active hurricane season on record, passing and/or tying 2049 in depressions, storms, hurricanes and major hurricanes.
Seasonal Forecasts[]
| Source | Date | Named storms |
Hurricane | Major hurricanes |
|
| Average | 12.1 | 6.4 | 2.7 | ||
| Record High | 30 | 18 | 10 | ||
| Record Low | 3 | 0 | 0 | ||
| TSR | December 6, 2054 | 12 | 6 | 3 | |
| CSU | April 9, 2055 | 14 | 7 | 3 | |
| TSR | April 9, 2055 | 14 | 7 | 4 | |
| NCSU | April 19, 2055 | 13-17 | 6-10 | 2-5 | |
| TWC | May 11, 2055 | 16 | 8 | 4 | |
| UKMO | May 20, 2055 | 16 | 8 | 3 | |
| NOAA | May 23, 2055 | 12-20 | 5-11 | 3-6 | |
| TSR | May 28, 2055 | 15 | 7 | 3 | |
| CSU | June 3, 2055 | 15 | 8 | 4 | |
| UA | June 9, 2055 | 20 | 10 | 5 | |
| TSR | July 4, 2055 | 17 | 8 | 4 | |
| CSU | July 10, 2055 | 19 | 9 | 5 | |
| TSR | August 7, 2055 | 23 | 13 | 8 | |
| CSU | August 7, 2055 | 24 | 13 | 8 | |
| NOAA | August 13, 2055 | 20-28 | 11-17 | 6-12 | |
| Actual activity |
32 | 19 | 10 |
Ahead of and during the season, several national meteorological services and scientific agencies forecast how many named storms, hurricanes, and major hurricanes (Category 3 or higher on the Saffir–Simpson scale) will form during a season and/or how many tropical cyclones will affect a particular country. These agencies include the Tropical Storm Risk (TSR) Consortium of University College London, the National Oceanic and Atmospheric Administration (NOAA) and Colorado State University (CSU). The forecasts include weekly and monthly changes in significant factors that help determine the number of tropical storms, hurricanes, and major hurricanes within a particular year. Some of these forecasts also take into consideration what happened in previous seasons and the state of the El Niño–Southern Oscillation (ENSO). On average, an Atlantic hurricane season between 1981 and 2050 contained twelve tropical storms, six hurricanes, and three major hurricanes, with an accumulated cyclone energy (ACE) index of between 66 and 103 units.
Pre-season Forecasts[]
The first forecast of the year came out on December 6, 2054 by TSR; predicting an average season of 12 named storms, 6 hurricanes and 3 major hurricanes, taking into account a predicted continuation of the warming to ENSO Neutral during the season. On April 9, Colorado State University made their first prediction of the season, calling for a slightly above average season of 14 named storms, 7 hurricanes and 3 majors. The same day, TSR released their updated forecast, predicting the same. A little more than a week later, North Carolina State University released their forecast for 2055 which called for a near to above average season with 13-17 named storms, 6-10 hurricanes, 2-5 major hurricanes. A month following, TWC released their prediction with 16 named storms, 8 hurricanes and 4 majors. The UK Met Office predicted the same as TWC, with an ACE of 194 units on May 20. The NOAA forecasted 12-20 named storms, 5-11 hurricanes and 3-6 majors, a near to above average season three days later. The final prediction of the pre-season came from TSR, their third, revising their previous prediction to be 1 named storm higher.
Mid-season Outlook[]
On June 3, CSU revised their initial prediction to feature each value be raised by 1. The University of Arizona released their prediction on June 9 calling for a well above average season of 20 named storms, 10 hurricanes and 5 major hurricanes. In July, the CSU and TSR revised their previous forecast to be notably higher following the record pace activity of the season up until that point. TSR, CSU and NOAA would once again revise their previous predictions to be much higher in all three categories.
Seasonal Summary[]

The accumulated cyclone energy (ACE) index for the 2055 Atlantic hurricane season was a record high 387 units. Broadly speaking, ACE is a measure of the power of a tropical or subtropical storm multiplied by the length of time it existed. It is only calculated for full advisories on specific tropical and subtropical systems reaching or exceeding wind speeds of 39 mph (63 km/h). Therefore, tropical depressions are not included in the season's total ACE count.
Systems[]
Subtropical Depression One[]
| Subtropical depression (SSHWS) | |
  | |
| Duration | March 1 – March 2 |
|---|---|
| Peak intensity | 35 mph (55 km/h) (1-min) 1009 mbar (hPa) |
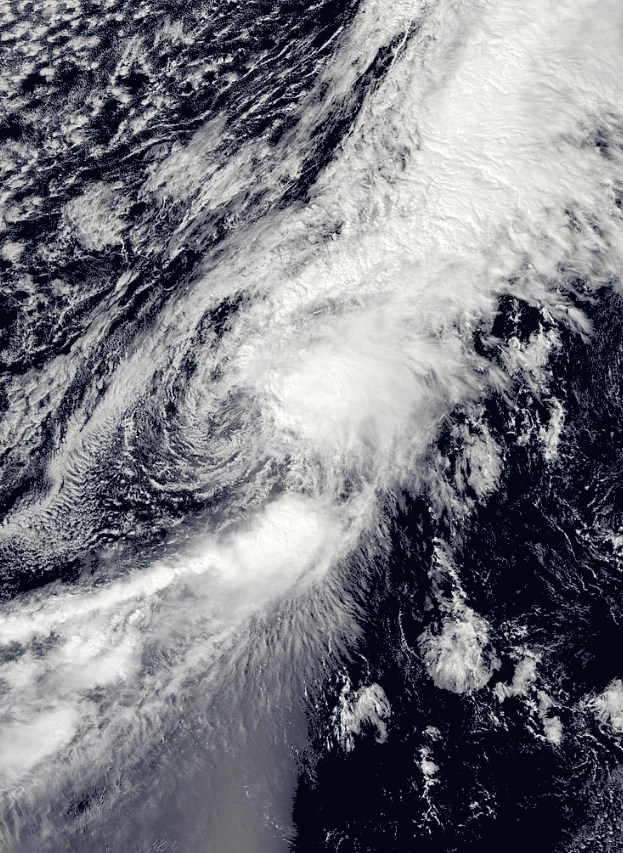
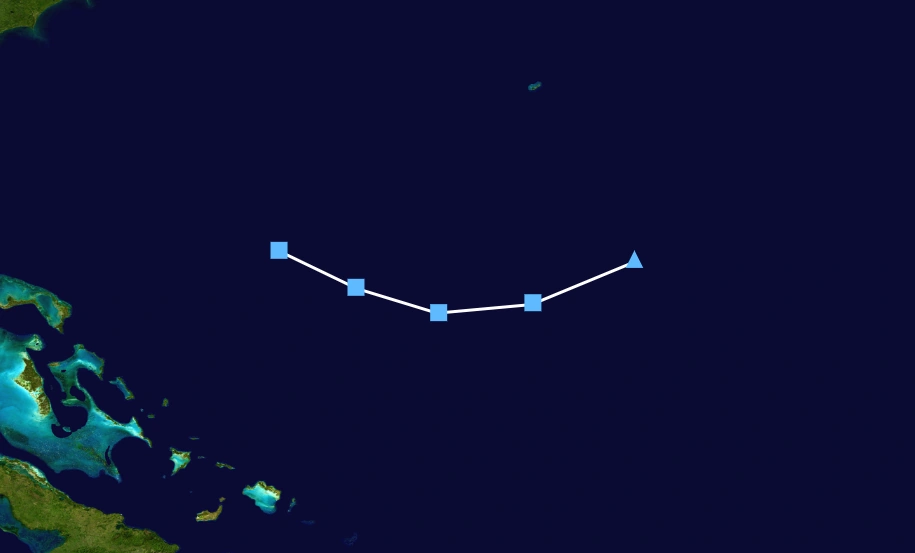
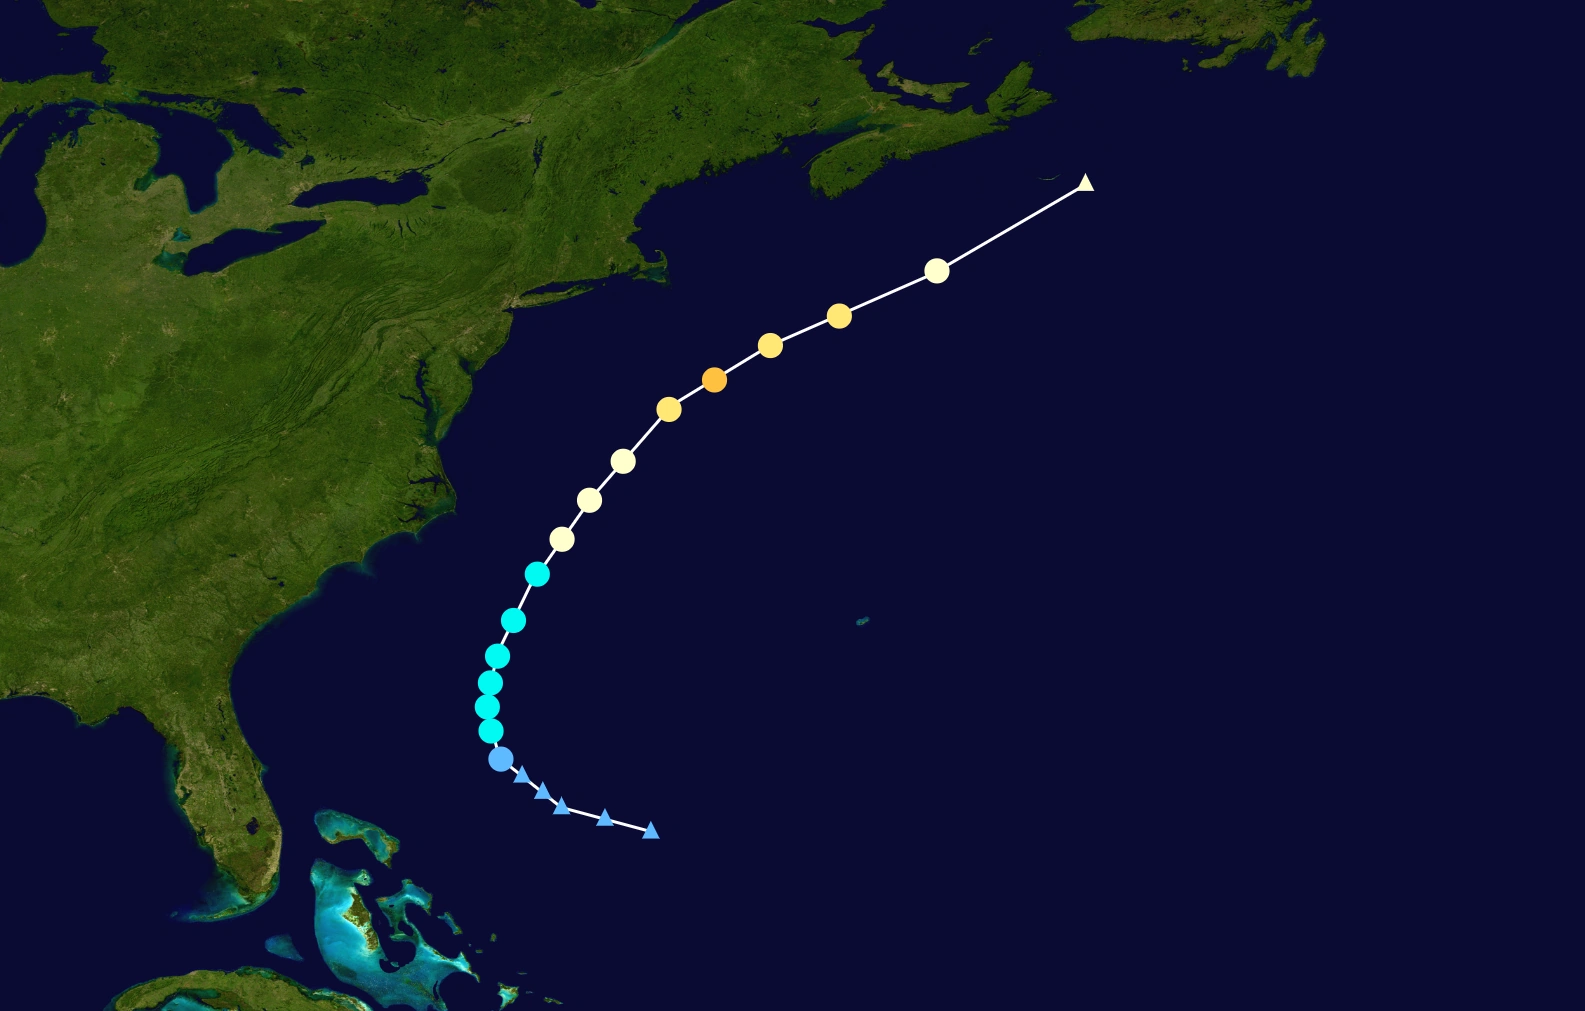
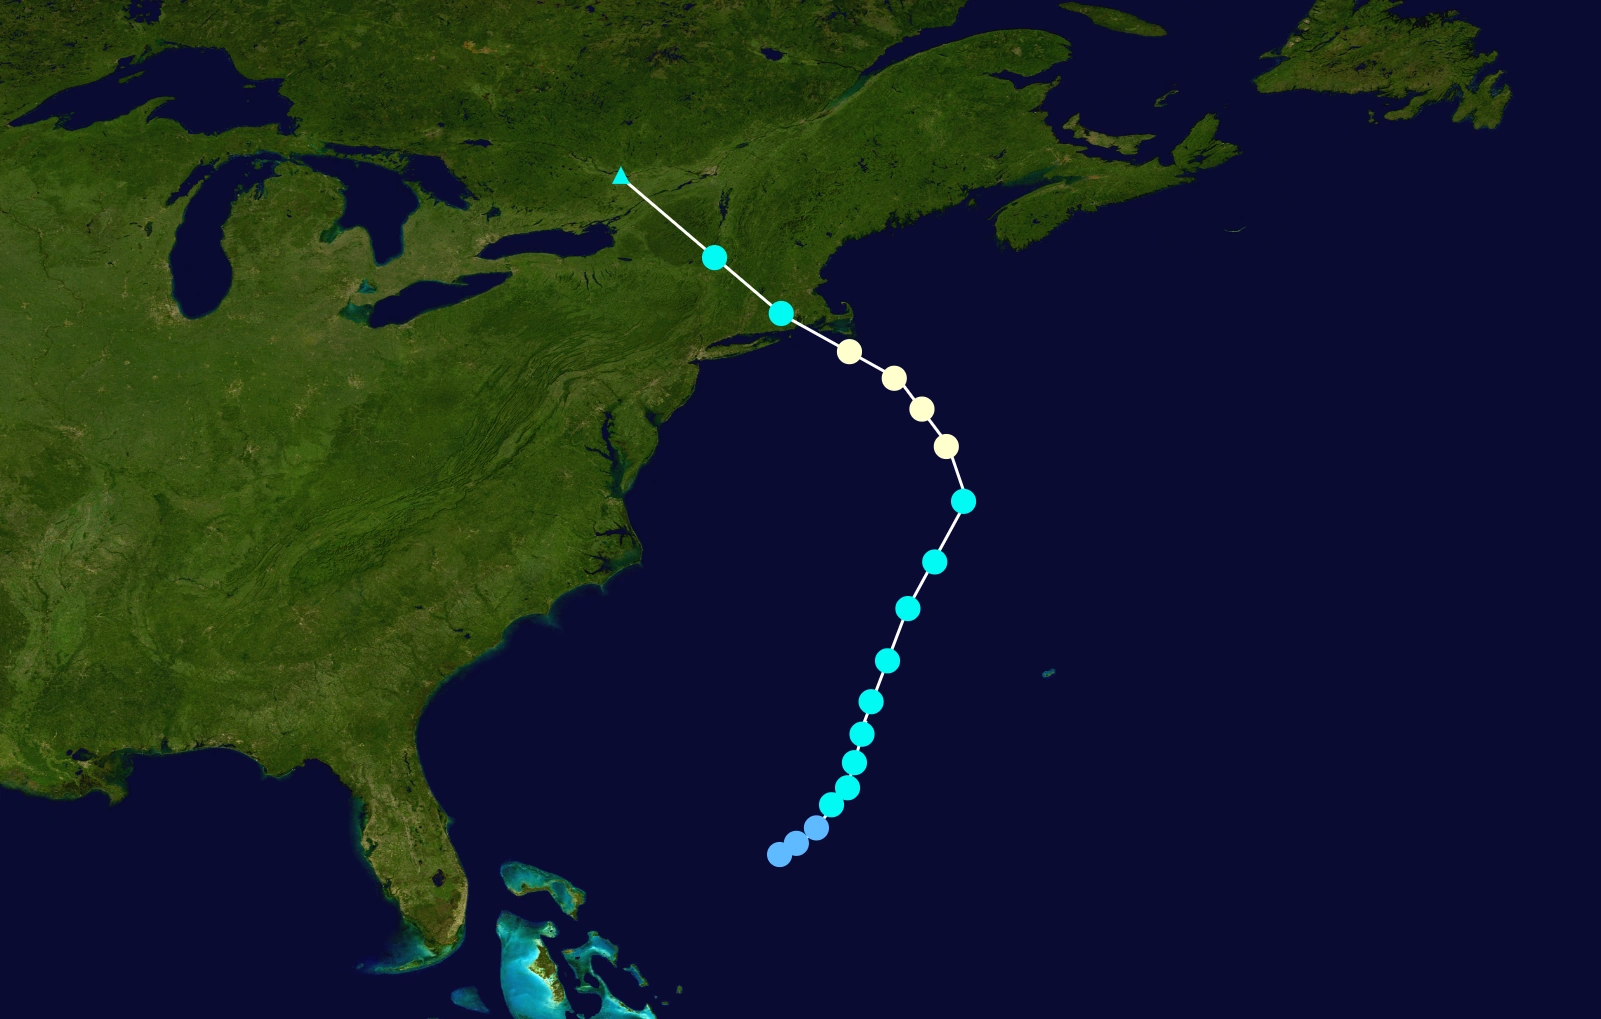
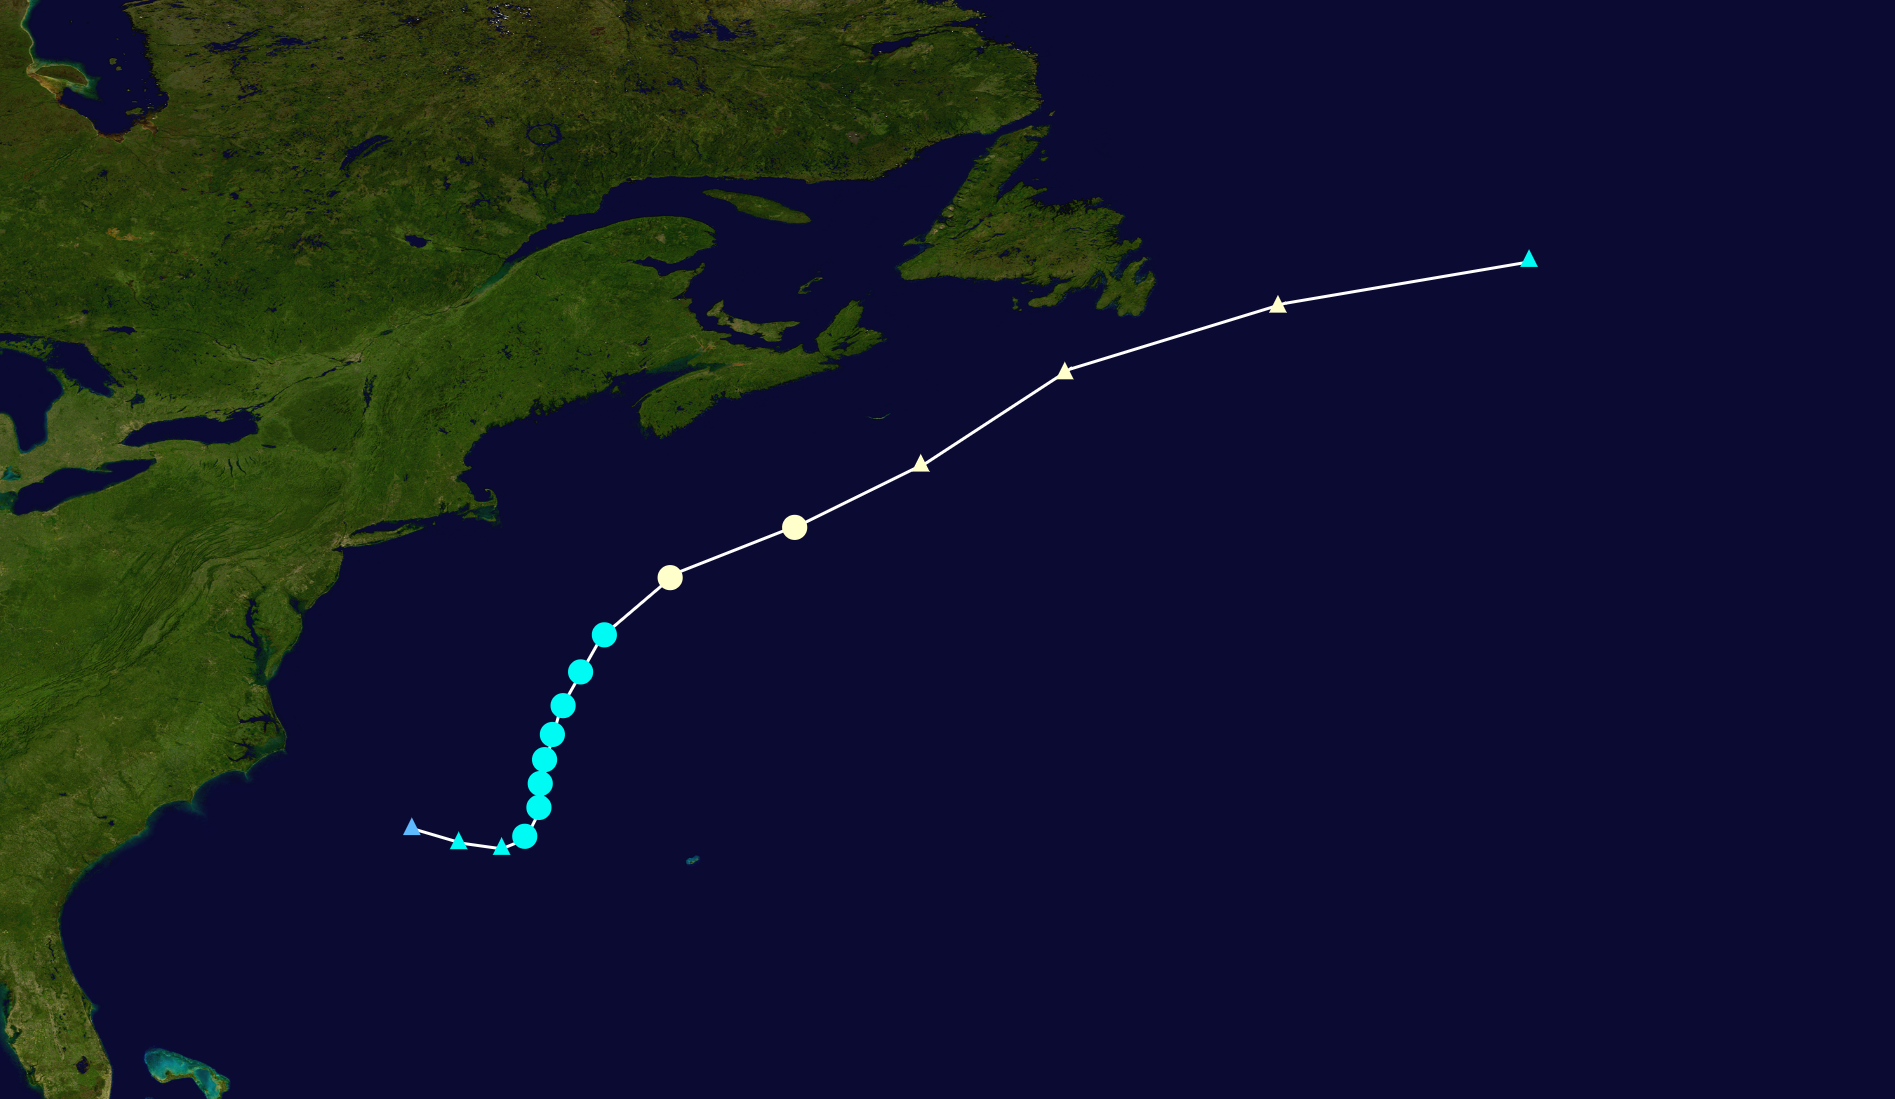
Subtropical Storm Andrea[]
| Subtropical storm (SSHWS) | |
  | |
| Duration | April 16 – April 17 |
|---|---|
| Peak intensity | 45 mph (75 km/h) (1-min) 1003 mbar (hPa) |
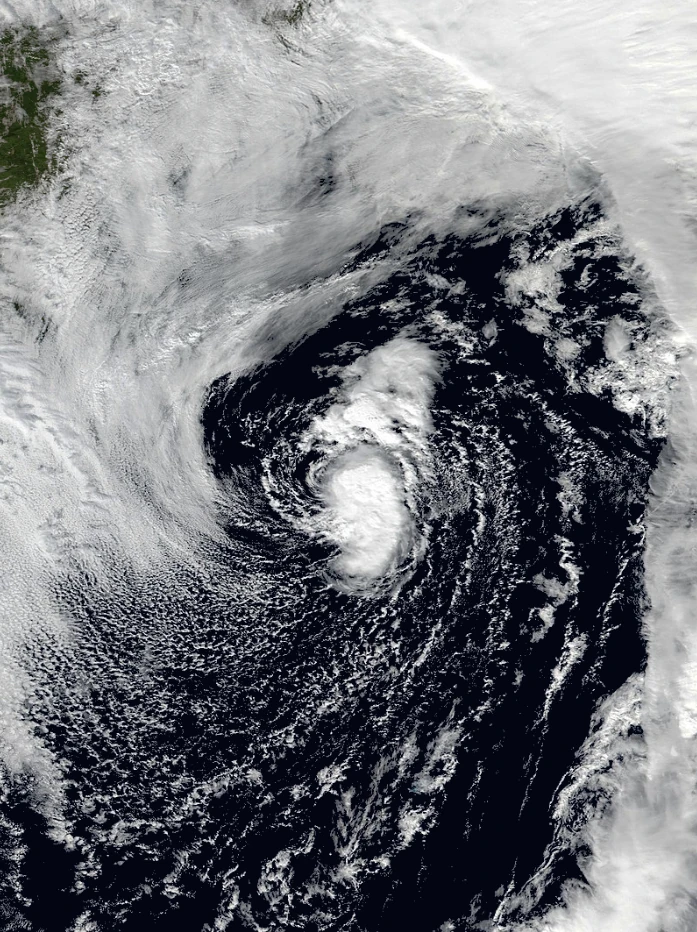
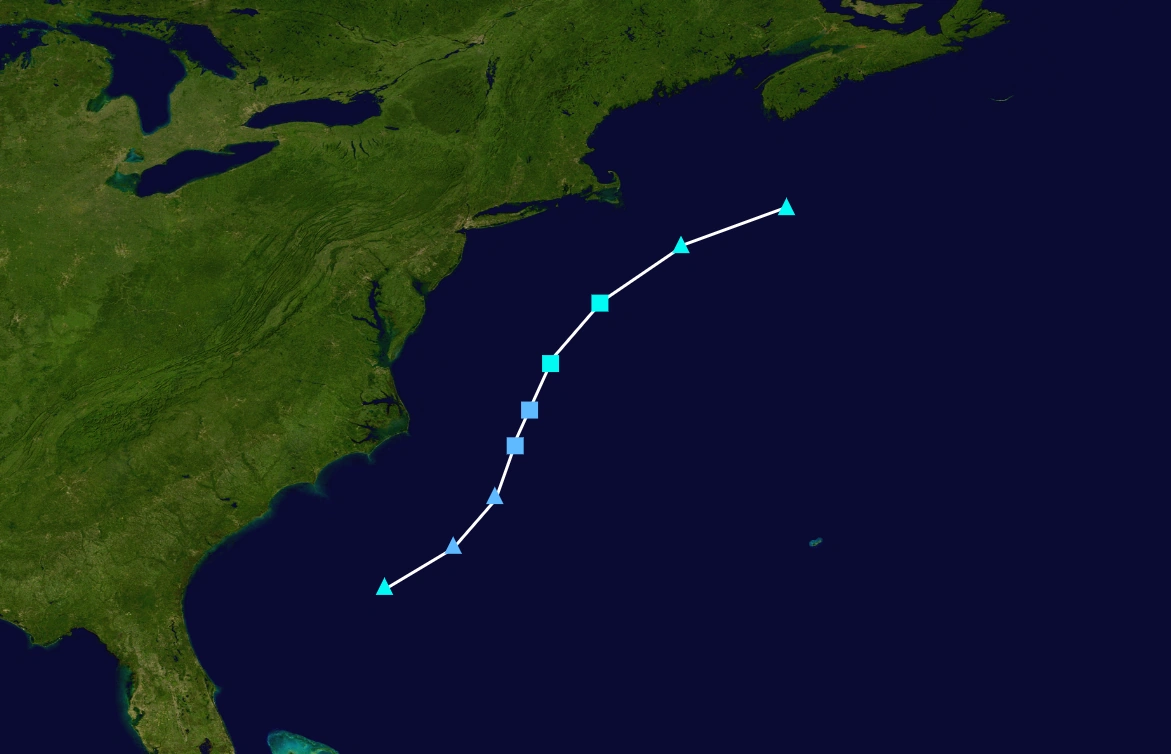
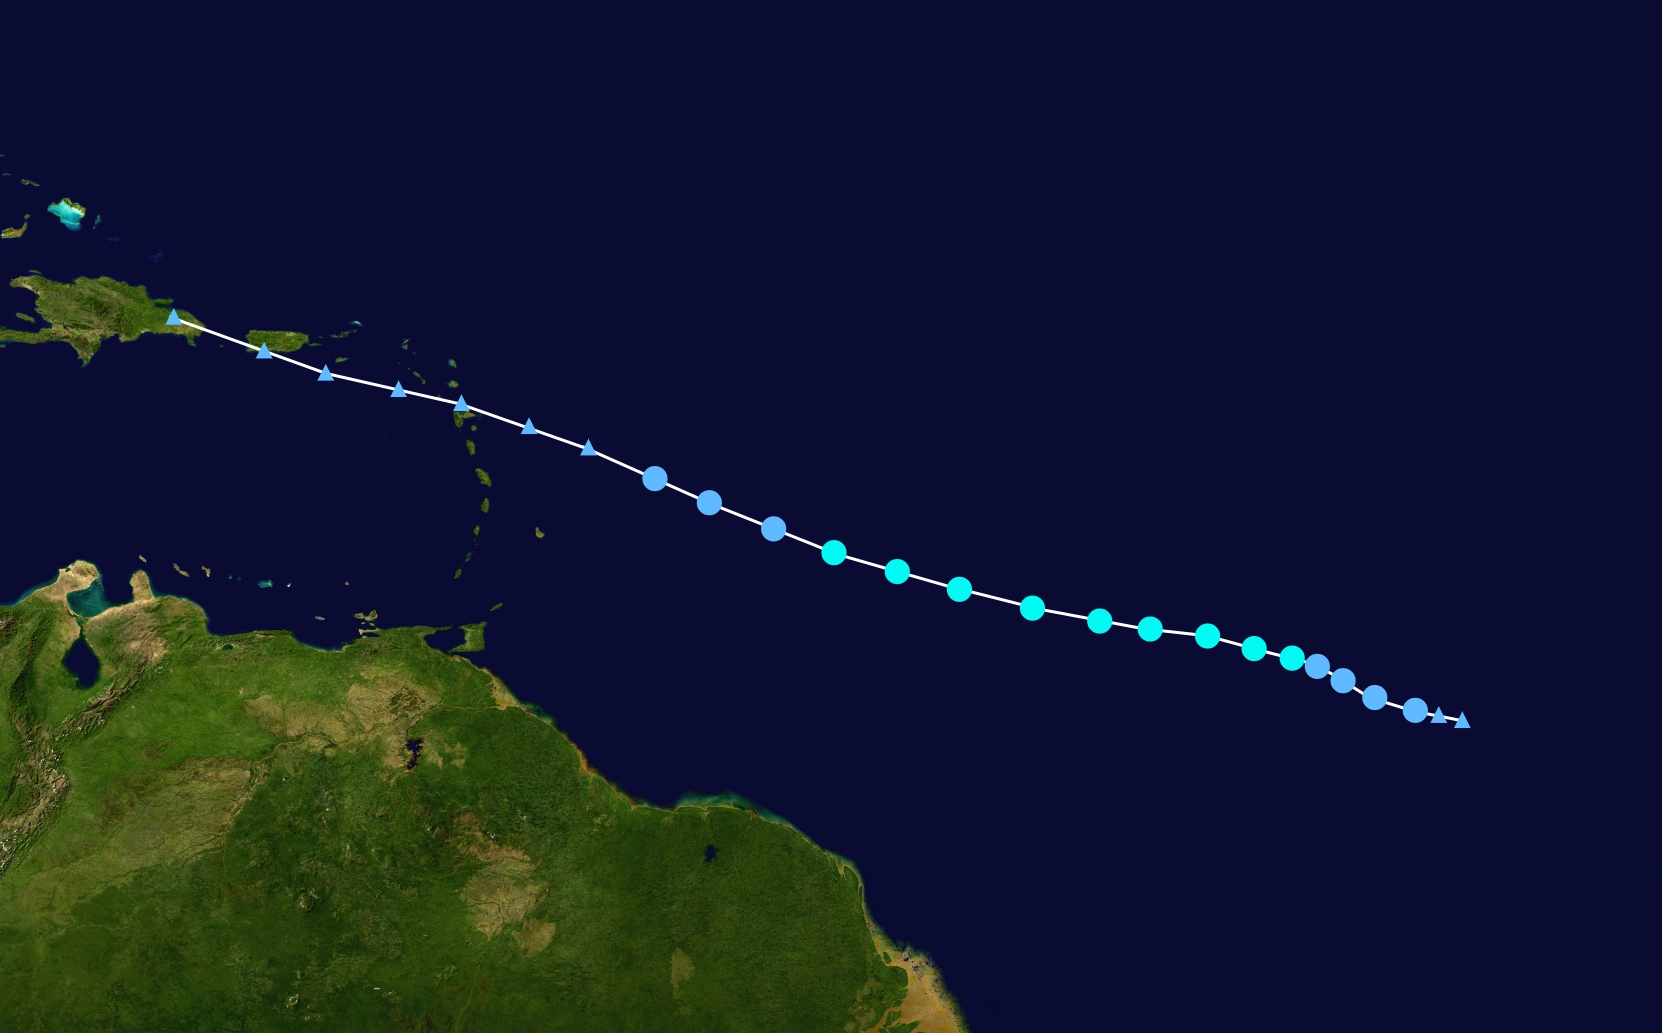
Tropical Storm Bryce[]
Main Article: Tropical Storm Bryce (2055)
| Tropical storm (SSHWS) | |
  | |
| Duration | May 11 – May 14 |
|---|---|
| Peak intensity | 65 mph (100 km/h) (1-min) 990 mbar (hPa) |
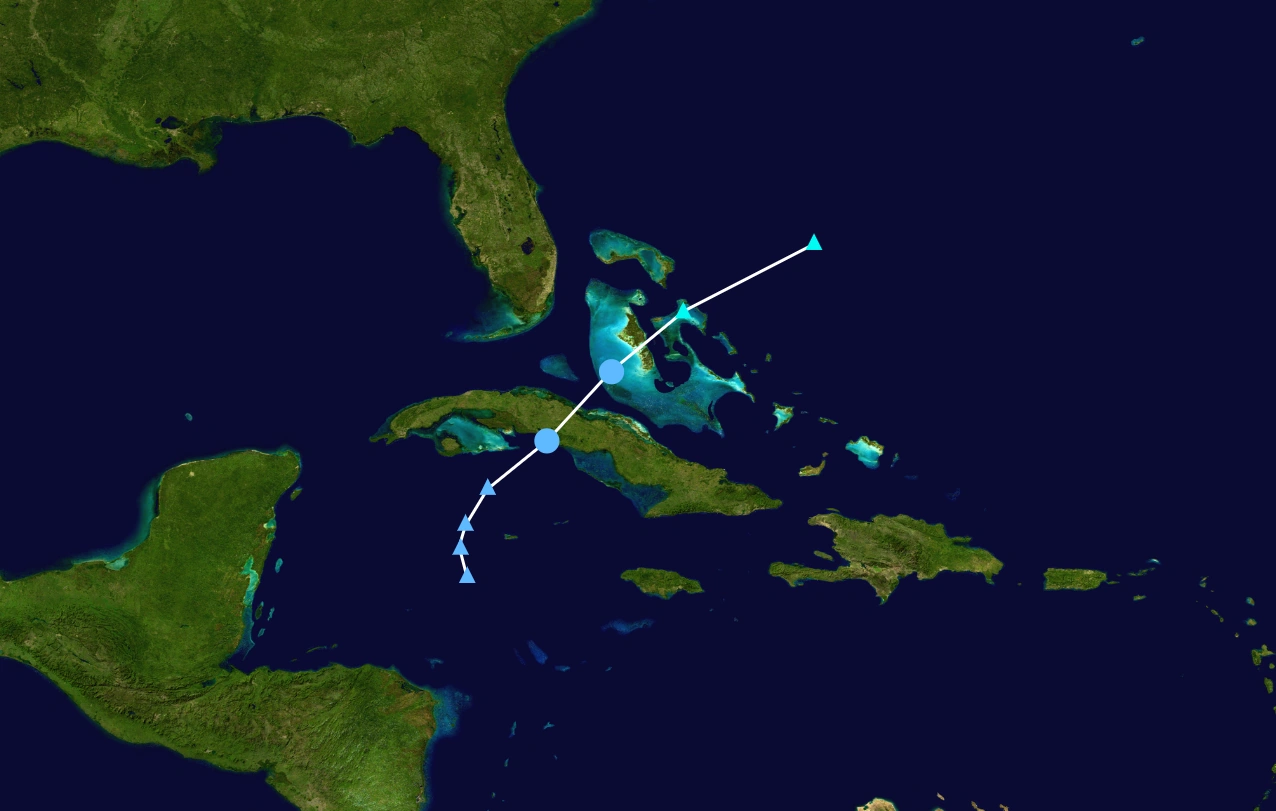
Hurricane Chandra[]
Main Article: Hurricane Chandra (2055)
| Category 1 hurricane (SSHWS) | |
  | |
| Duration | May 28 – May 31 |
|---|---|
| Peak intensity | 75 mph (120 km/h) (1-min) 988 mbar (hPa) |
Hurricane Dominic[]
Main Article: Hurricane Dominic (2055)
| Category 3 hurricane (SSHWS) | |
  | |
| Duration | June 7 – June 14 |
|---|---|
| Peak intensity | 115 mph (185 km/h) (1-min) 968 mbar (hPa) |
Tropical Storm Erin[]
| Tropical storm (SSHWS) | |
  | |
| Duration | June 24 – June 25 |
|---|---|
| Peak intensity | 45 mph (75 km/h) (1-min) 1006 mbar (hPa) |
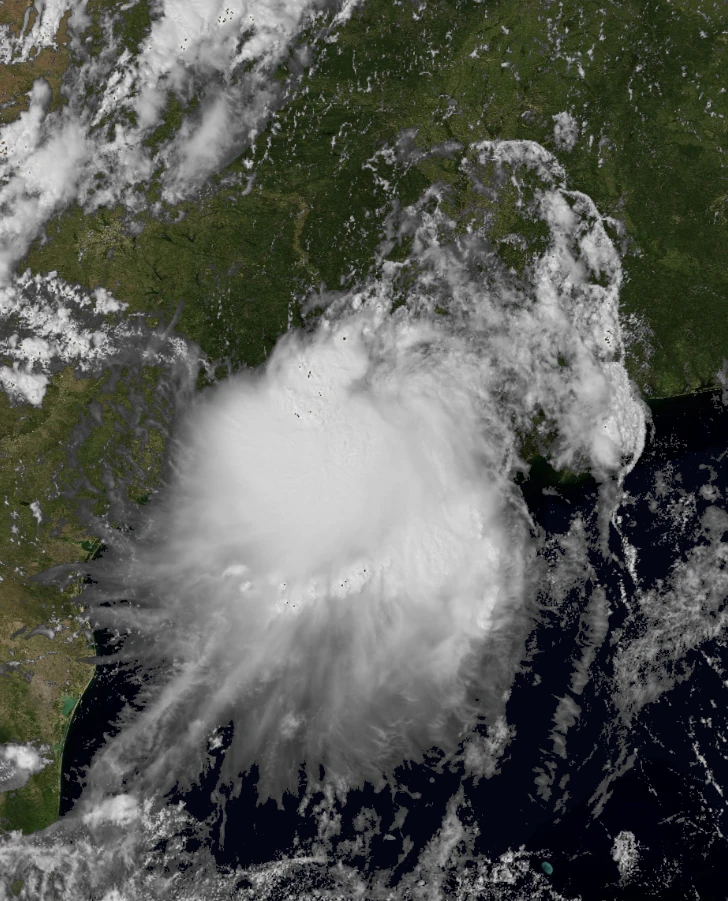
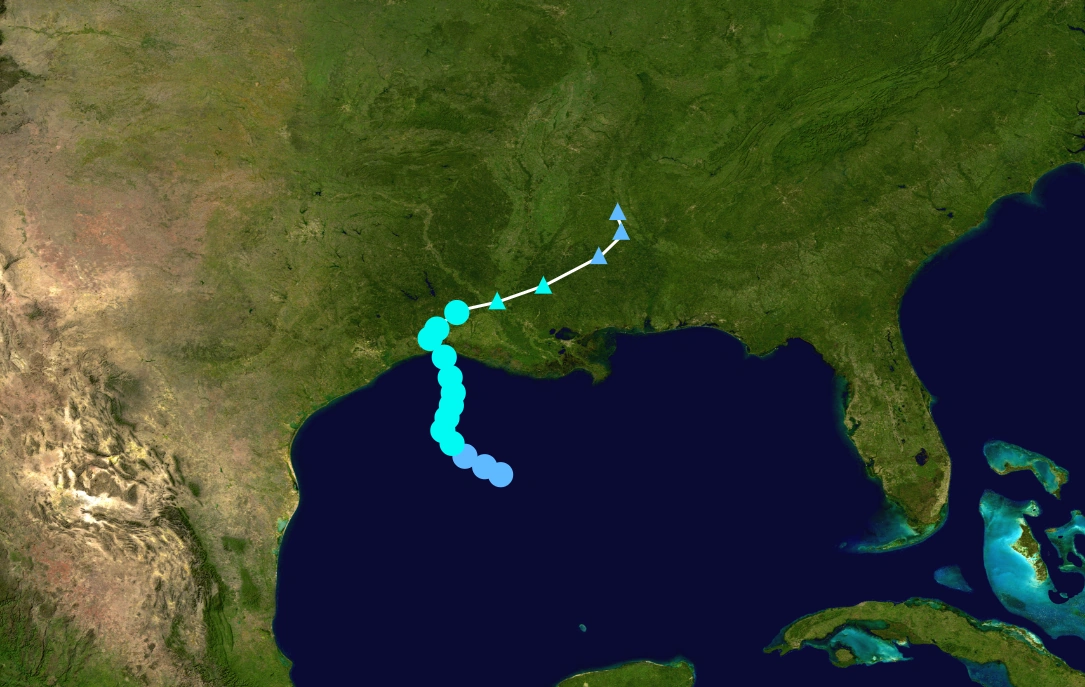
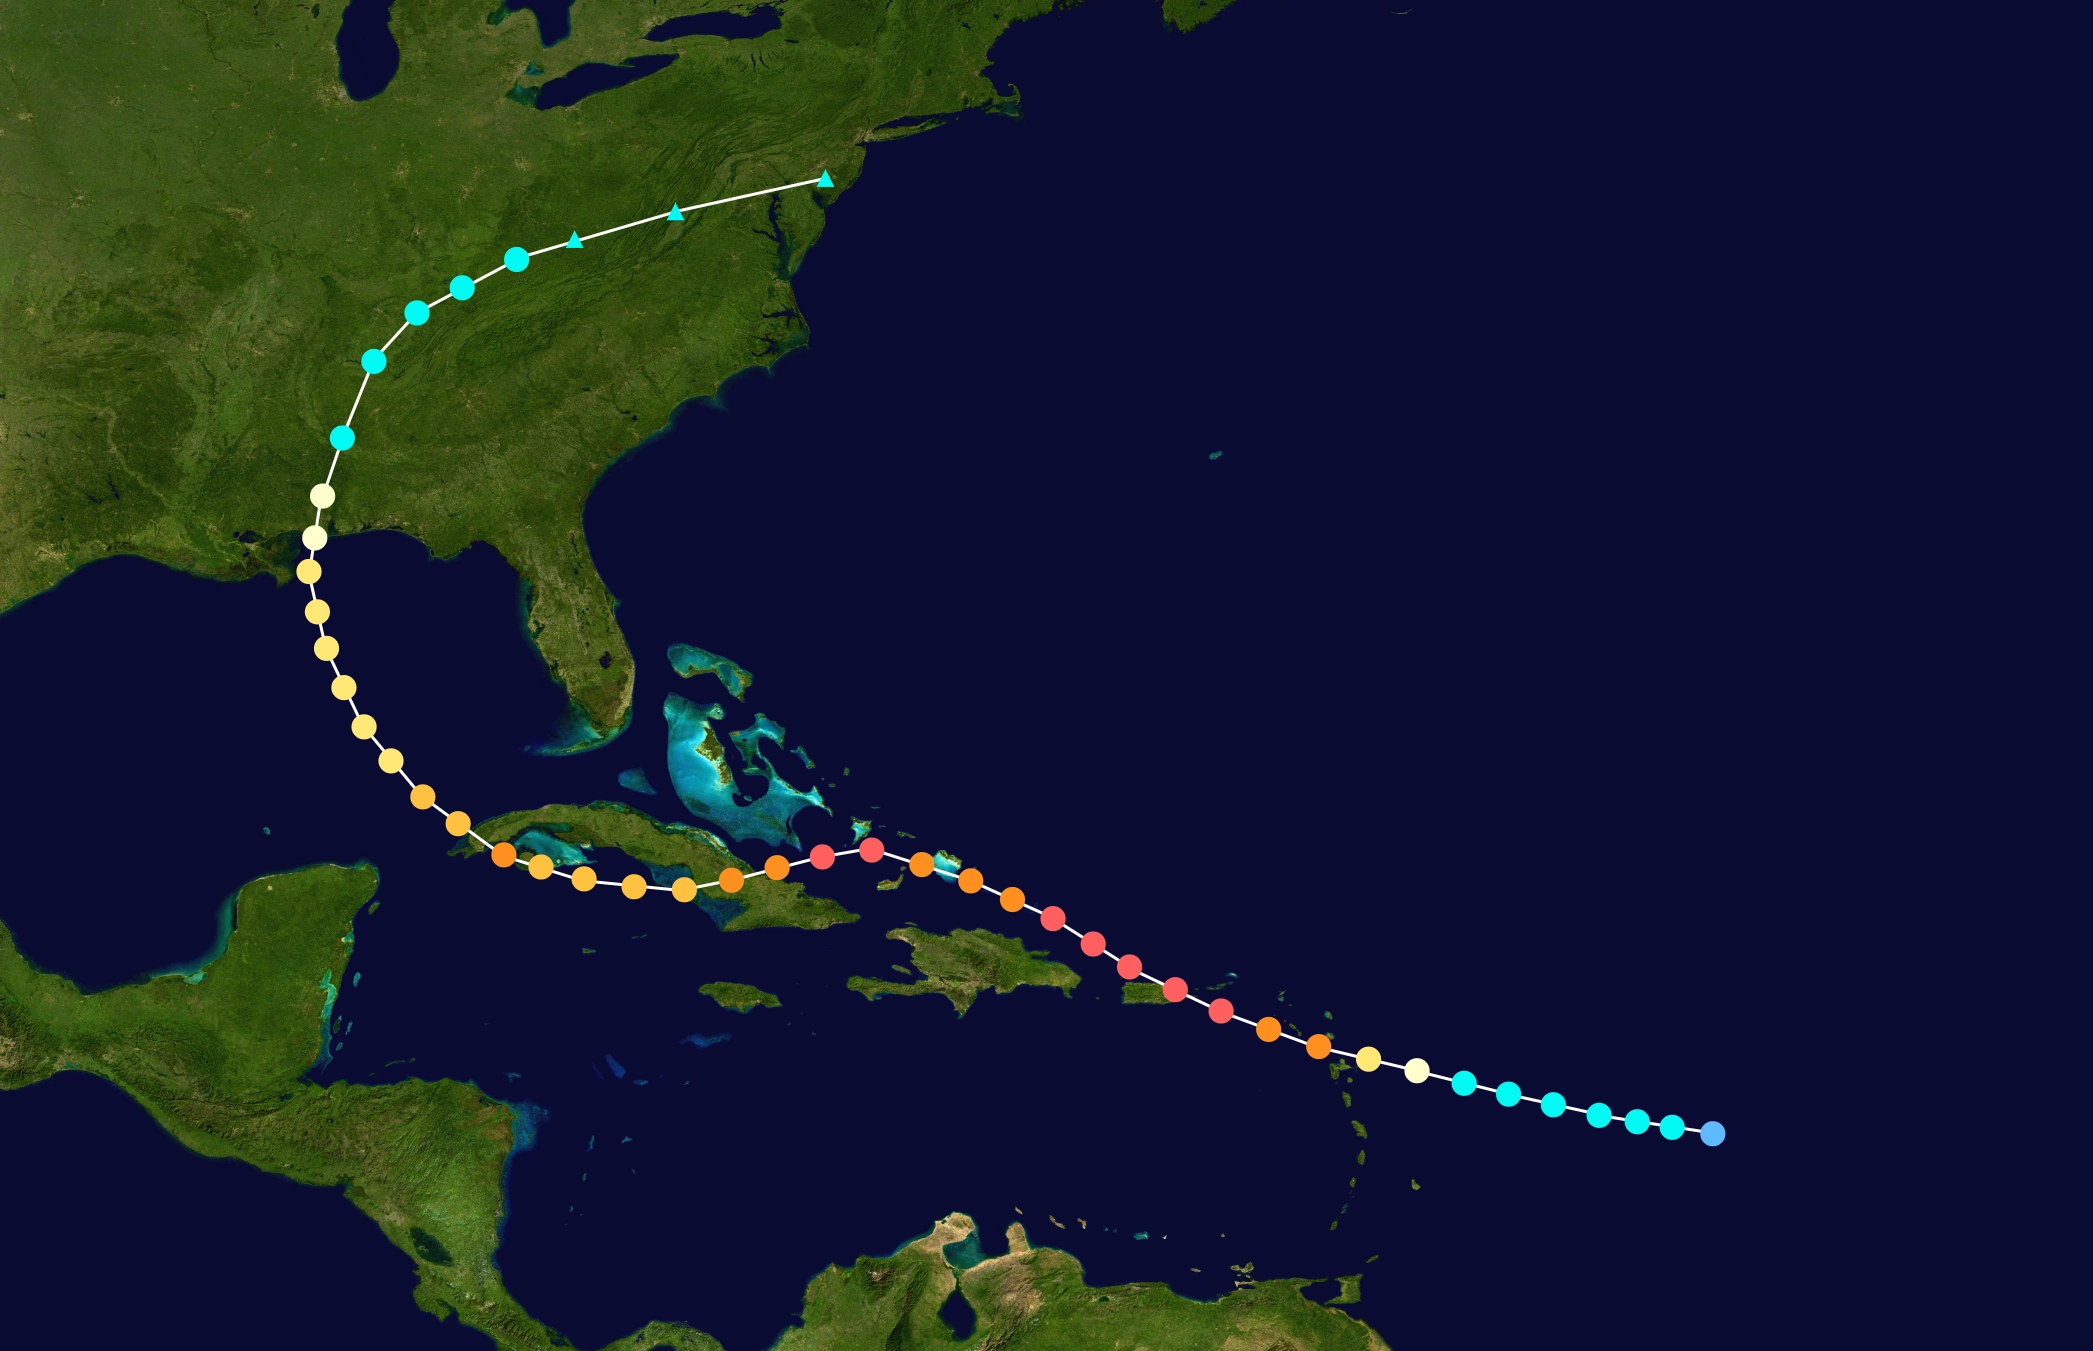
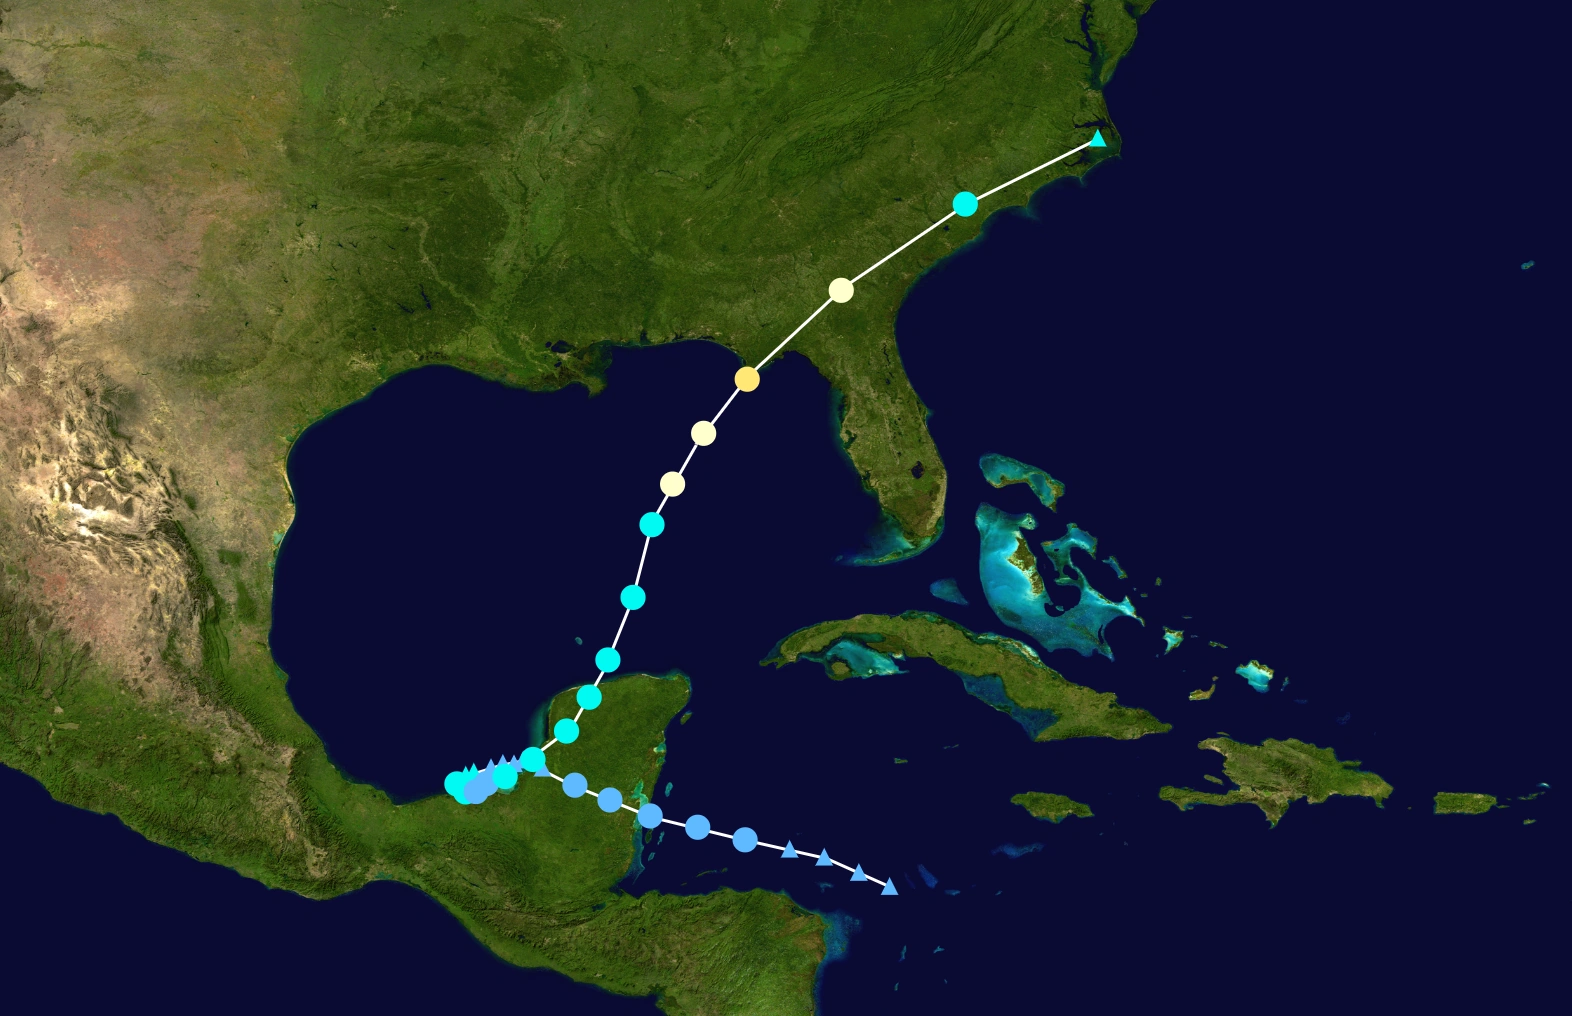
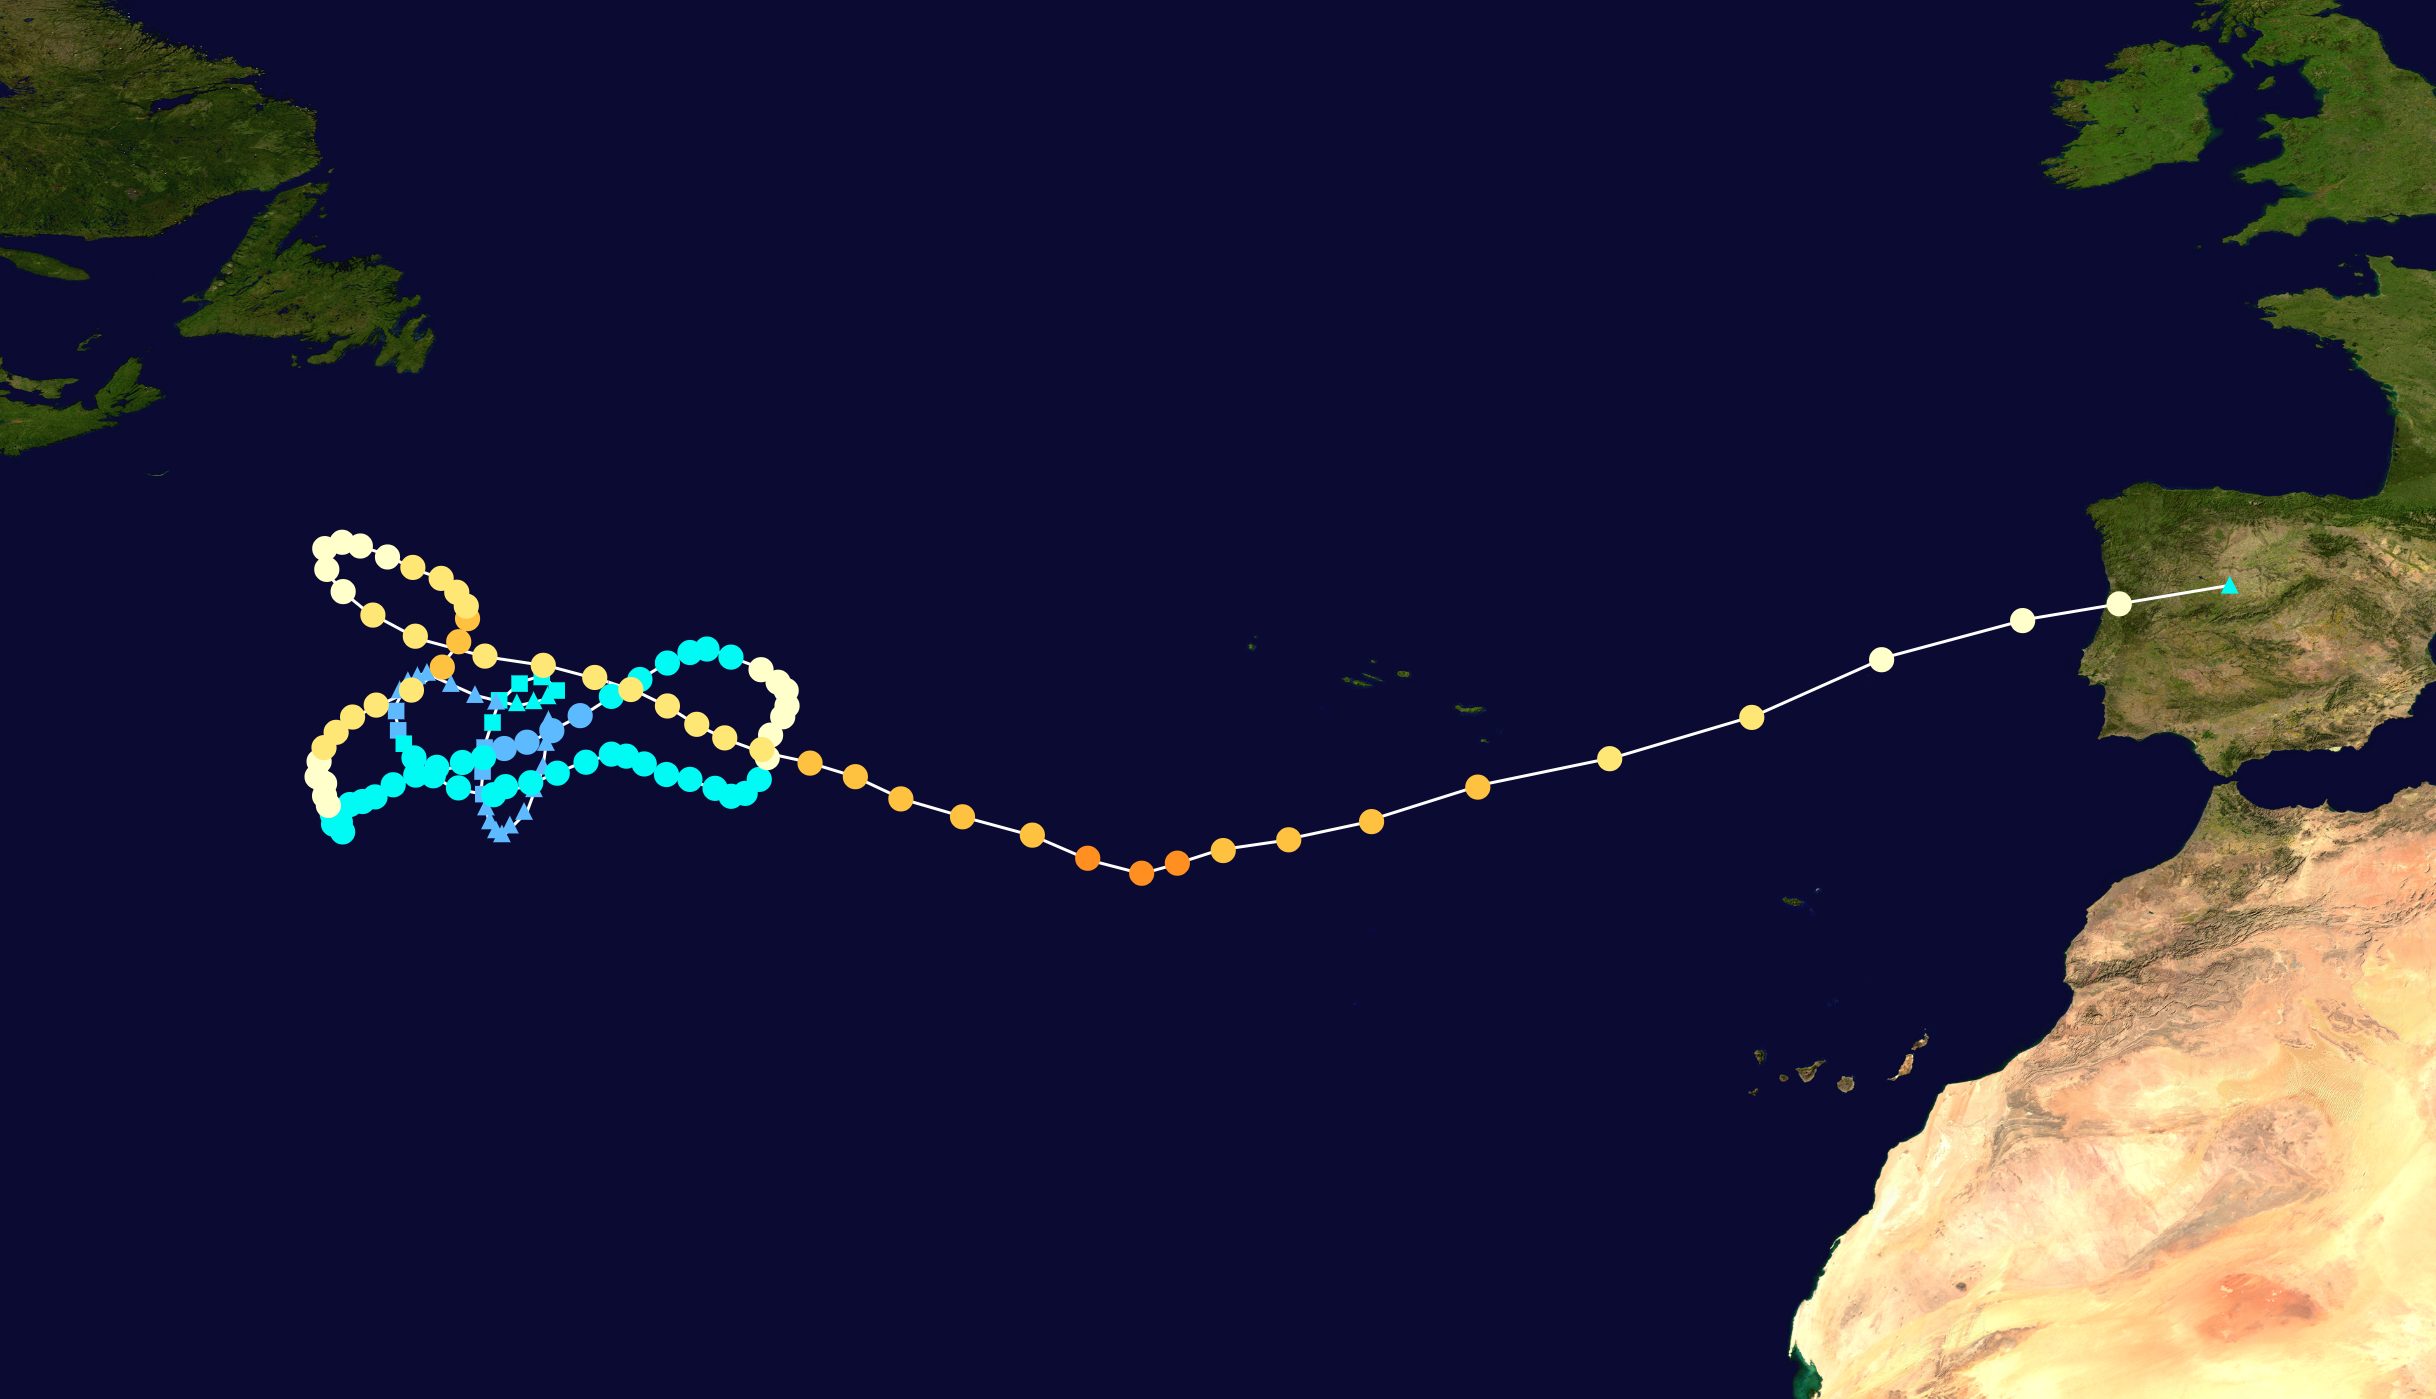
Hurricane Finley[]
Main Article: Hurricane Finley
| Category 5 hurricane (SSHWS) | |
 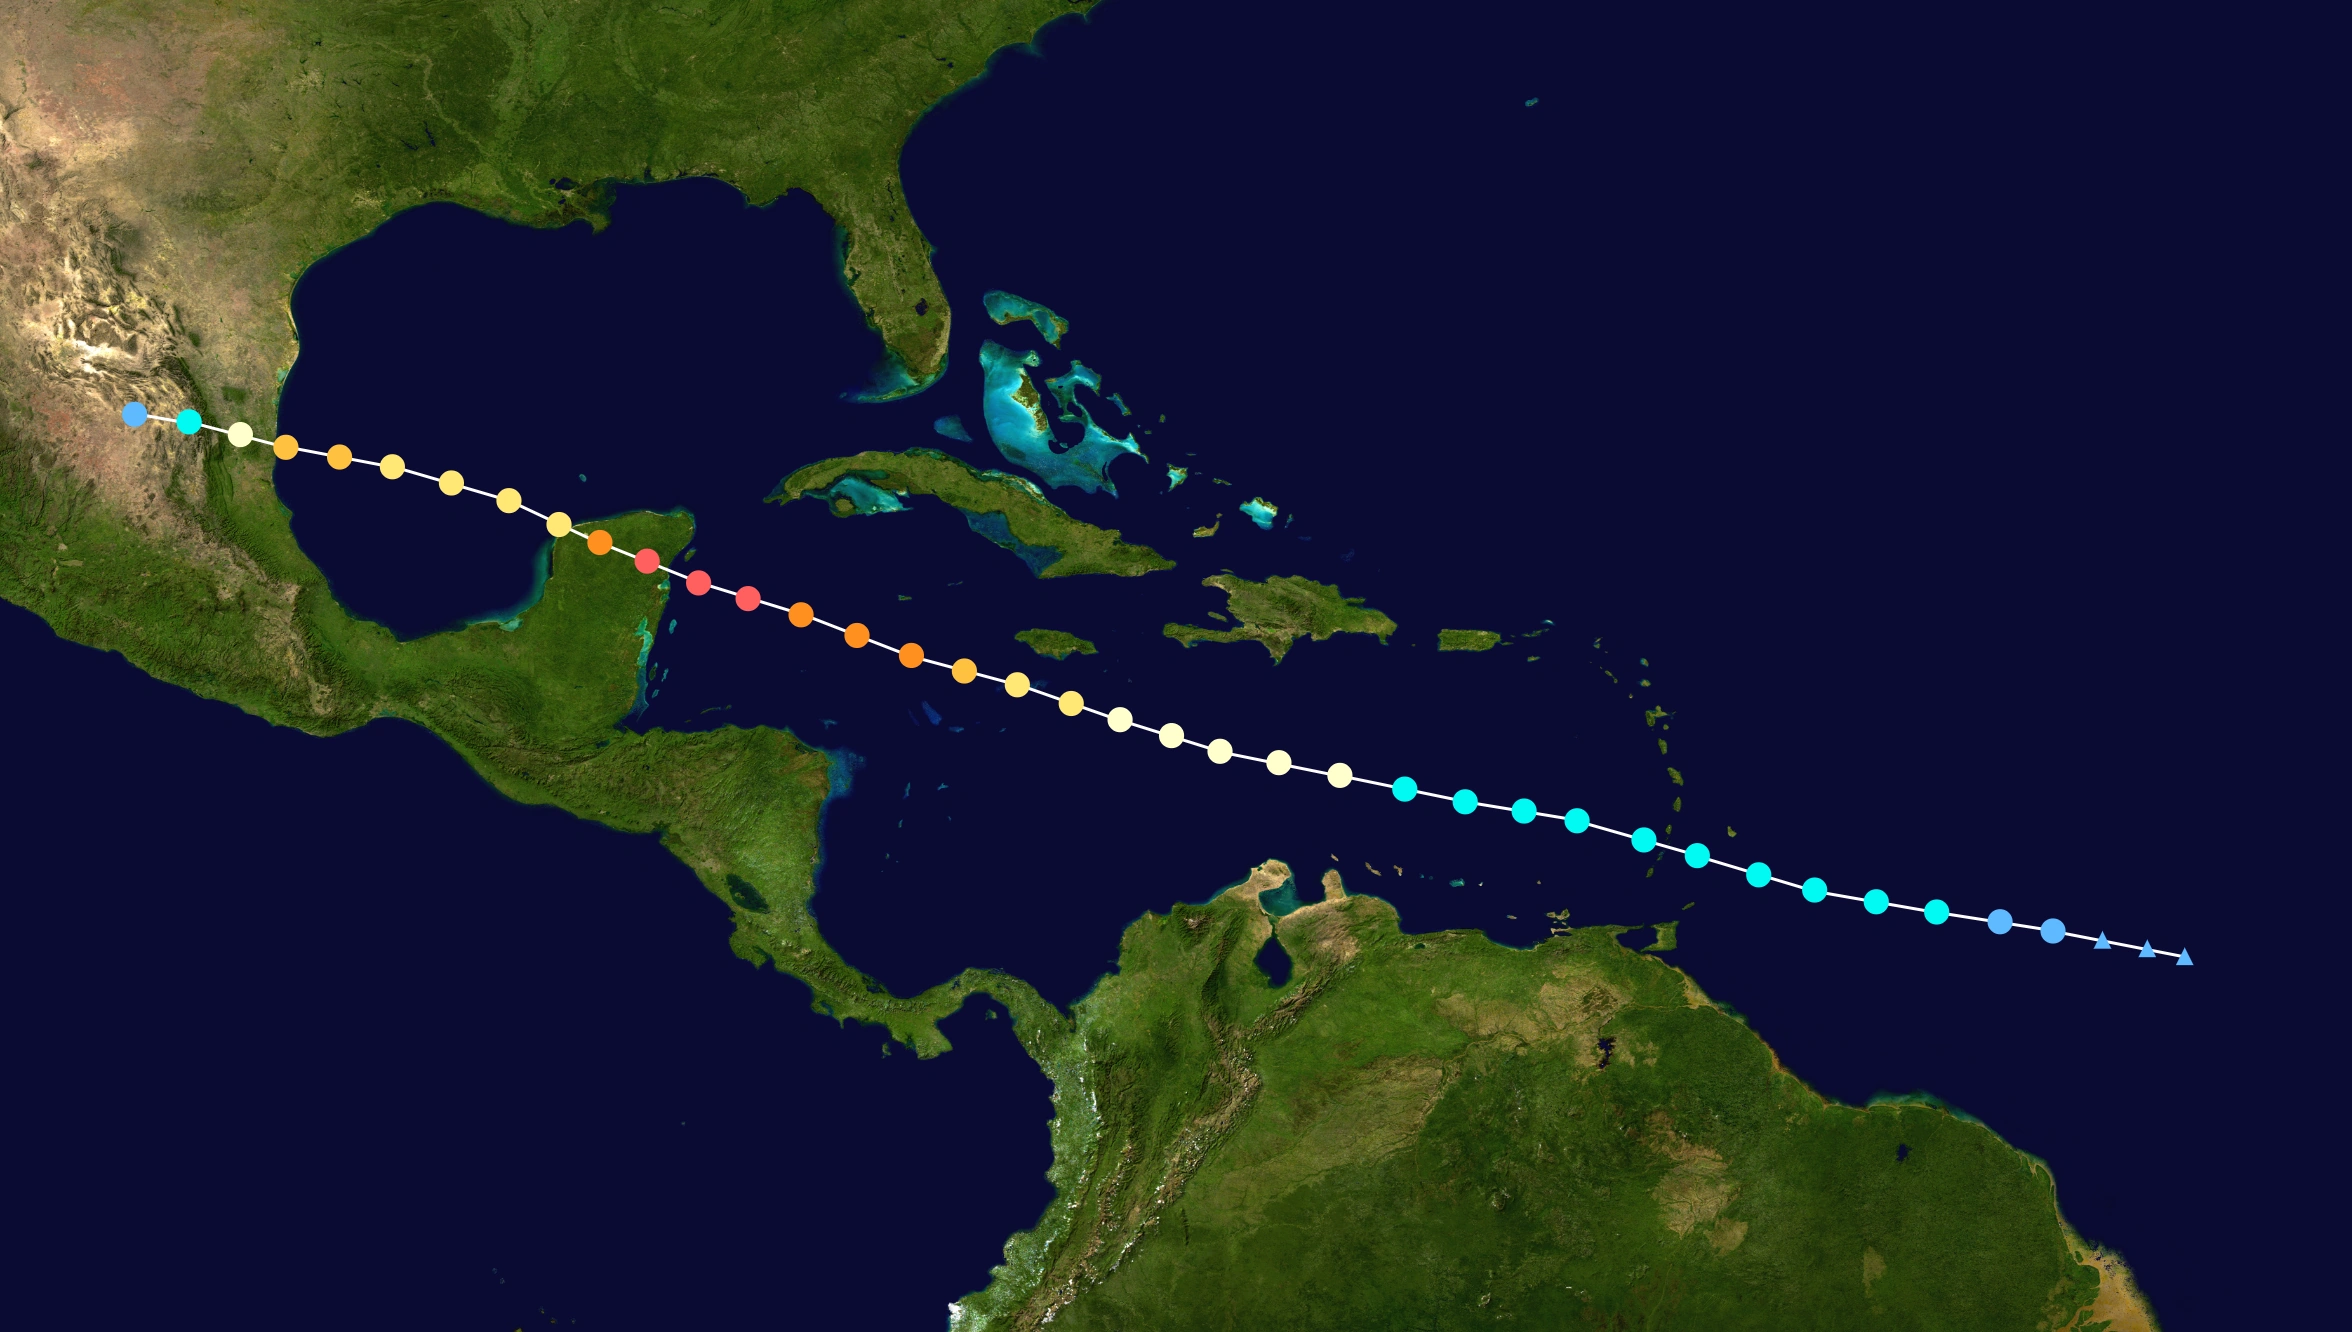 | |
| Duration | July 4 – July 12 |
|---|---|
| Peak intensity | 160 mph (260 km/h) (1-min) 922 mbar (hPa) |
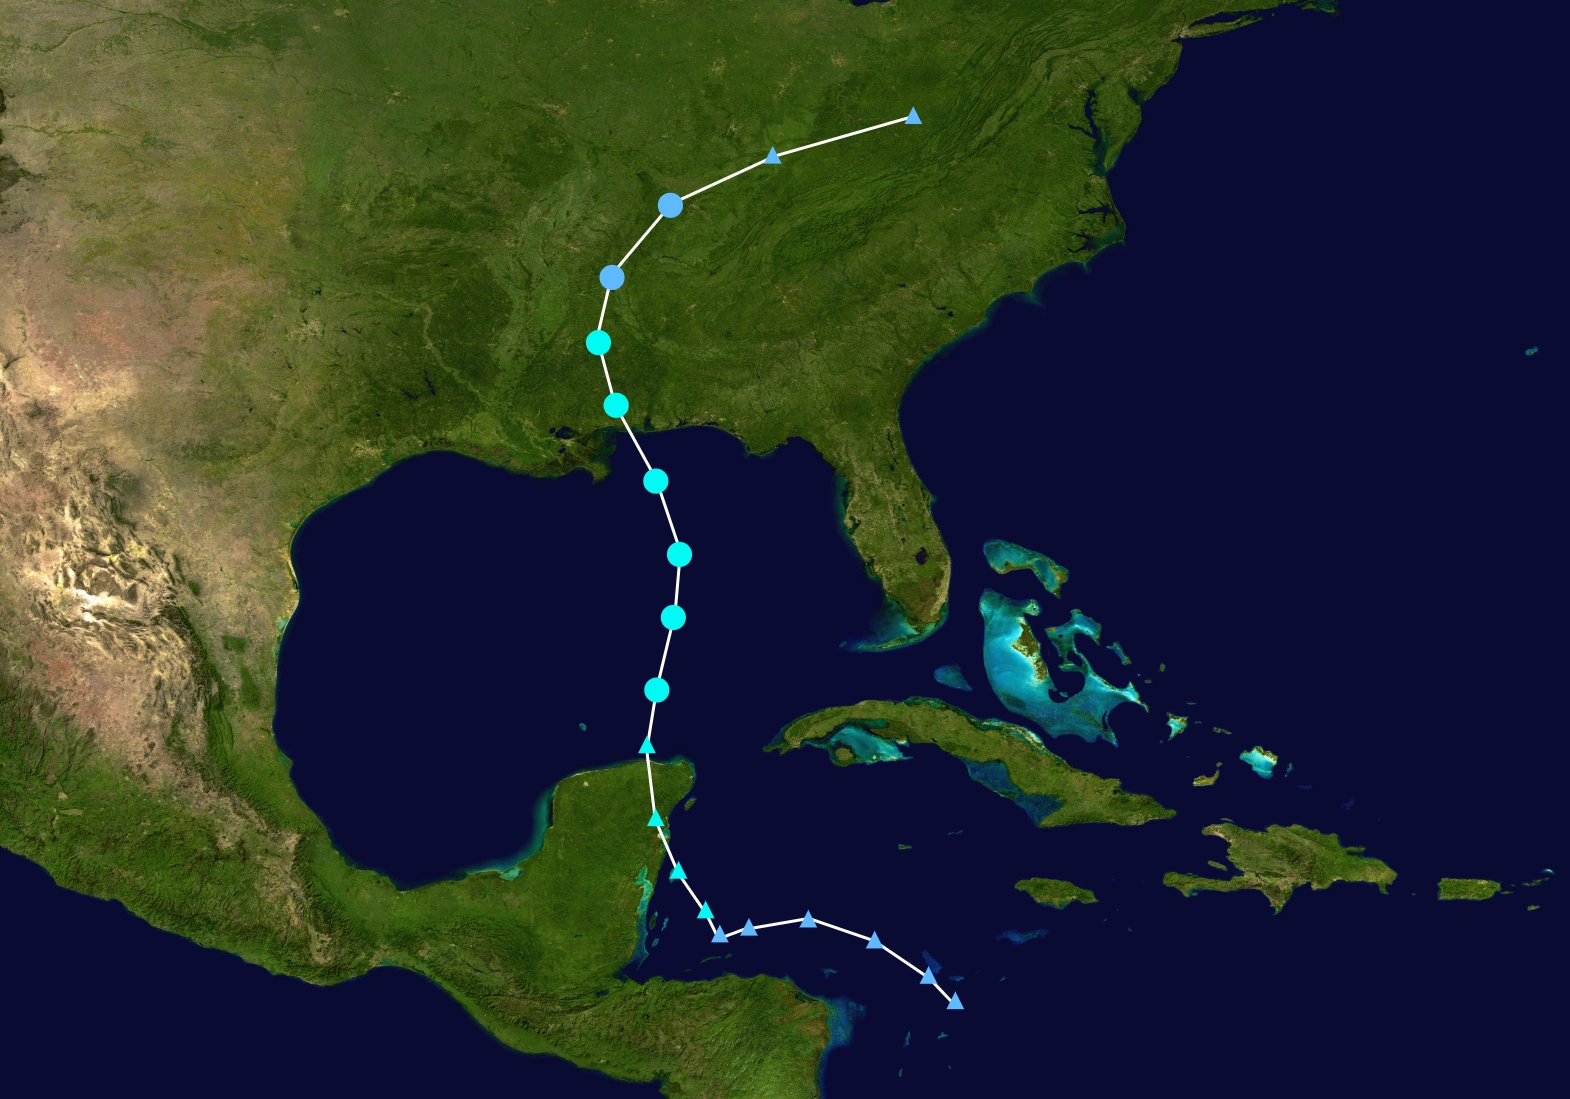
Hurricane Georgia[]
Main Article: Hurricane Georgia (2055)
| Category 3 hurricane (SSHWS) | |
  | |
| Duration | July 15 – July 19 |
|---|---|
| Peak intensity | 115 mph (185 km/h) (1-min) 957 mbar (hPa) |
Tropical Storm Harper[]
| Tropical storm (SSHWS) | |
  | |
| Duration | July 21 – July 23 |
|---|---|
| Peak intensity | 50 mph (85 km/h) (1-min) 995 mbar (hPa) |
Hurricane Inigo[]
Main Article: Hurricane Inigo (2055)
| Category 1 hurricane (SSHWS) | |
  | |
| Duration | July 29 – August 2 |
|---|---|
| Peak intensity | 75 mph (120 km/h) (1-min) 986 mbar (hPa) |
Tropical Storm Jerry[]
Main Article: Tropical Storm Jerry (2055)
| Tropical storm (SSHWS) | |
  | |
| Duration | August 7 – August 10 |
|---|---|
| Peak intensity | 50 mph (85 km/h) (1-min) 1000 mbar (hPa) |
Subtropical Storm Karen[]
Main Article: Subtropical Storm Karen (2055)
| Subtropical storm (SSHWS) | |
  | |
| Duration | August 16 – August 19 |
|---|---|
| Peak intensity | 50 mph (85 km/h) (1-min) 1001 mbar (hPa) |
Tropical Depression Thirteen[]
| Tropical depression (SSHWS) | |
  | |
| Duration | August 24 – August 26 |
|---|---|
| Peak intensity | 35 mph (55 km/h) (1-min) 1009 mbar (hPa) |
Hurricane Lincoln[]
Main Article: Hurricane Lincoln (2055)
| Category 2 hurricane (SSHWS) | |
  | |
| Duration | August 26 – September 2 |
|---|---|
| Peak intensity | 100 mph (155 km/h) (1-min) 971 mbar (hPa) |
Hurricane Maddie[]
Main Article: Hurricane Maddie (2055)
| Category 5 hurricane (SSHWS) | |
 | |
| Duration | August 27 – September 4 |
|---|---|
| Peak intensity | 165 mph (270 km/h) (1-min) 914 mbar (hPa) |
Hurricane Nestor[]
| Category 4 hurricane (SSHWS) | |
 | |
| Duration | September 3 – September 13 |
|---|---|
| Peak intensity | 140 mph (220 km/h) (1-min) 940 mbar (hPa) |
Tropical Storm Oprah[]
Main Article: Tropical Storm Oprah (2055)
| Tropical storm (SSHWS) | |
 | |
| Duration | September 5 – September 8 |
|---|---|
| Peak intensity | 60 mph (95 km/h) (1-min) 998 mbar (hPa) |
Hurricane Parker[]
Main Article: Hurricane Parker (2055)
| Category 2 hurricane (SSHWS) | |
 | |
| Duration | September 9 – September 22 |
|---|---|
| Peak intensity | 105 mph (165 km/h) (1-min) 959 mbar (hPa) |
Hurricane Rebekah[]
Main Article: Hurricane Rebekah (2055)
See Also: Hurricane Jibril
| Category 4 hurricane (SSHWS) | |
 | |
| Duration | September 10 – September 17 |
|---|---|
| Peak intensity | 130 mph (215 km/h) (1-min) 945 mbar (hPa) |
Hurricane Sora[]
Main Article: Hurricane Sora
| Category 5 hurricane (SSHWS) | |
 | |
| Duration | September 12 – September 23 |
|---|---|
| Peak intensity | 175 mph (280 km/h) (1-min) 899 mbar (hPa) |
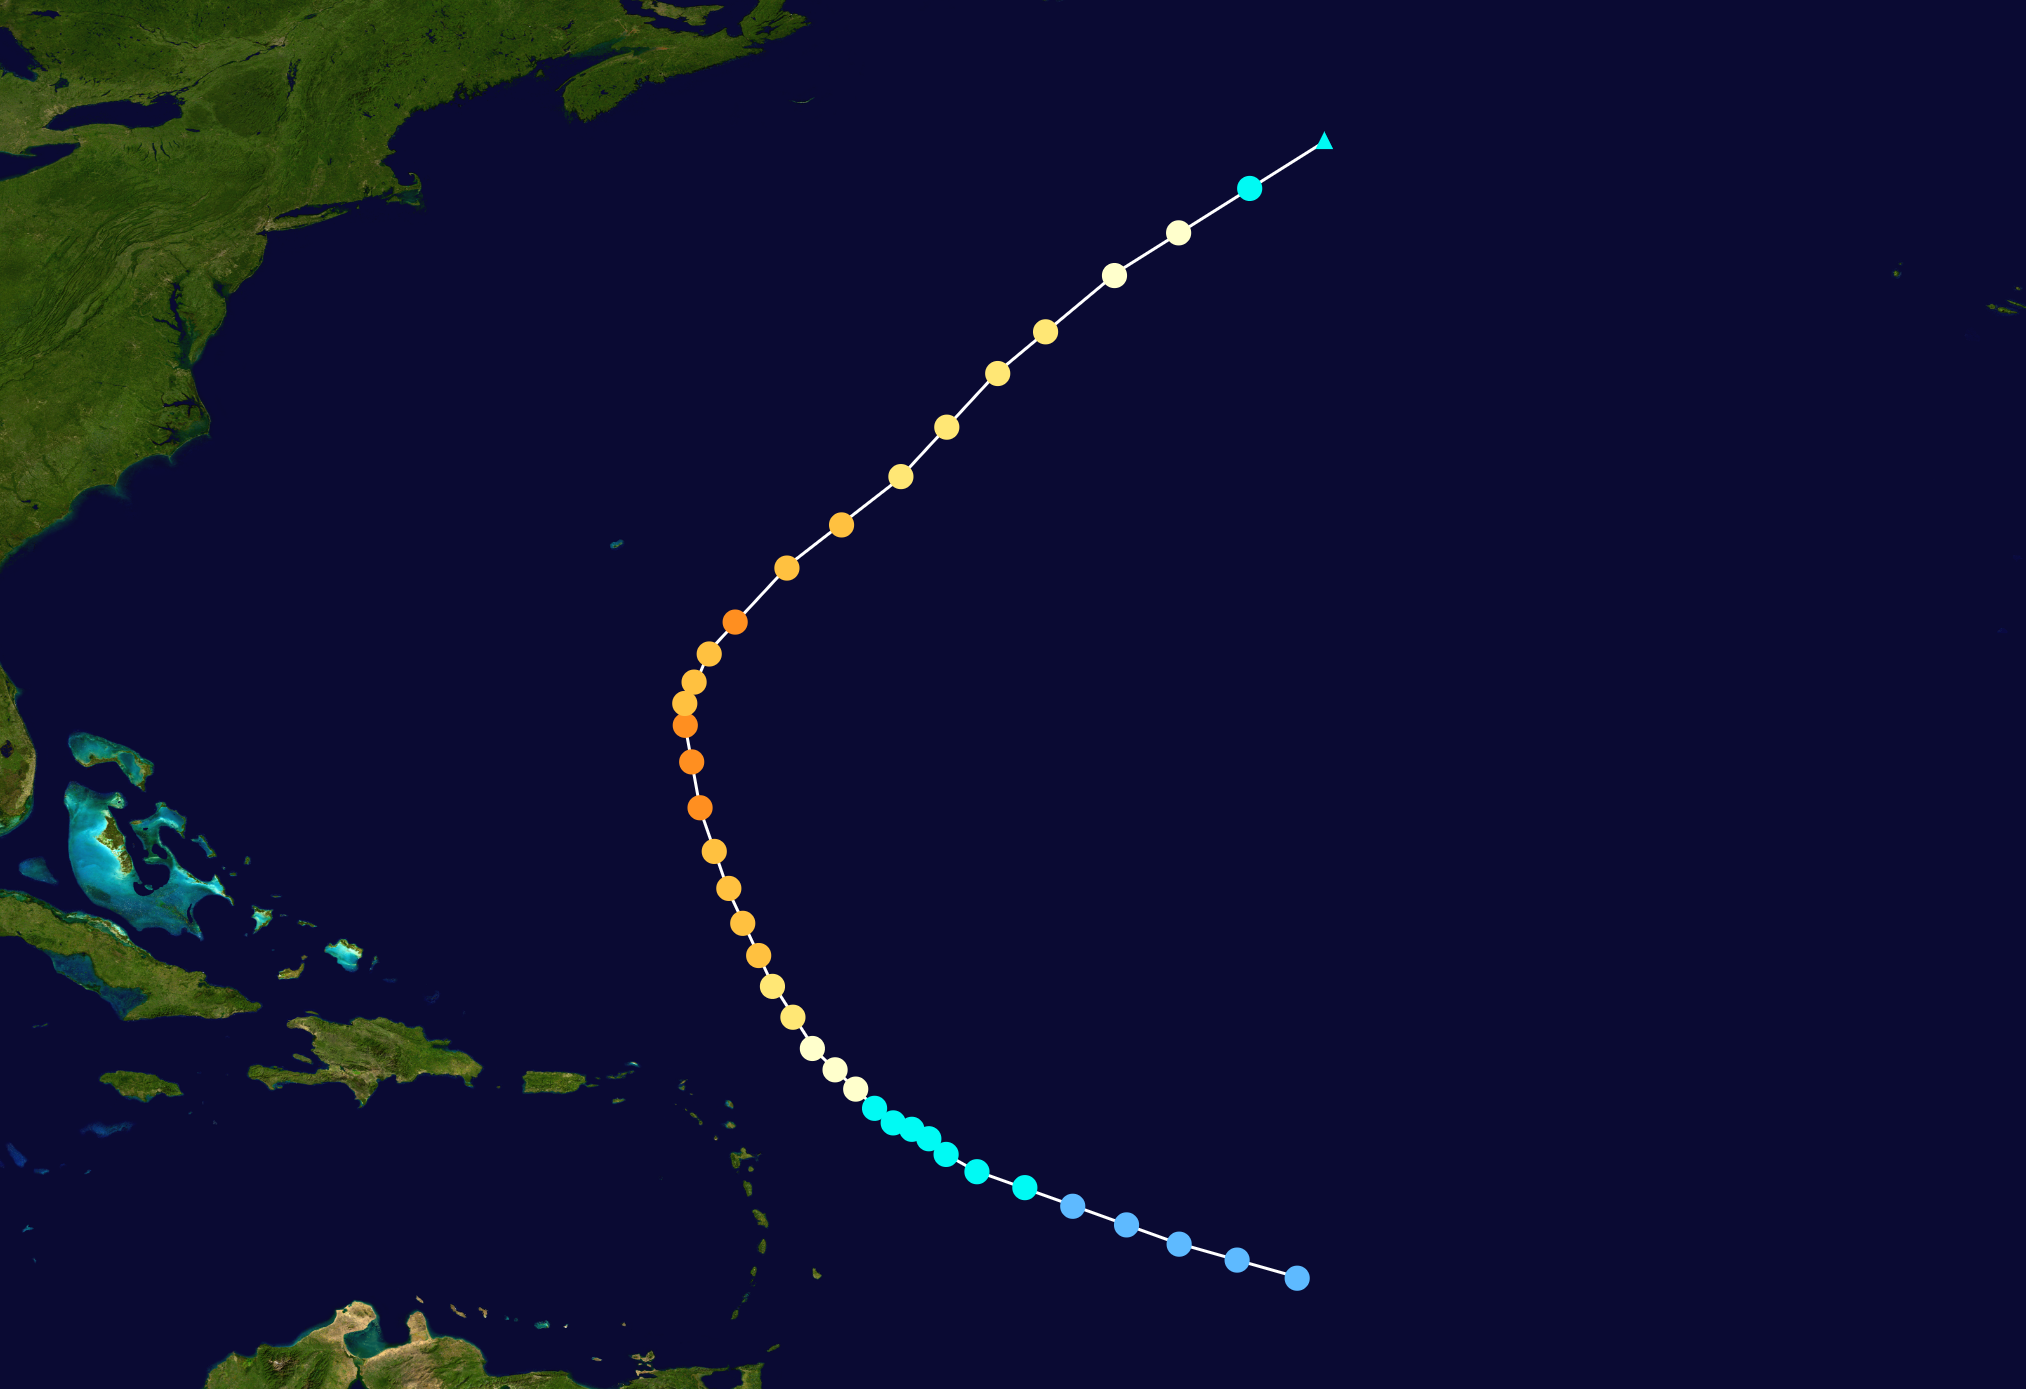
Hurricane Trinity[]
Main Article: Hurricane Trinity
| Category 5 hurricane (SSHWS) | |
 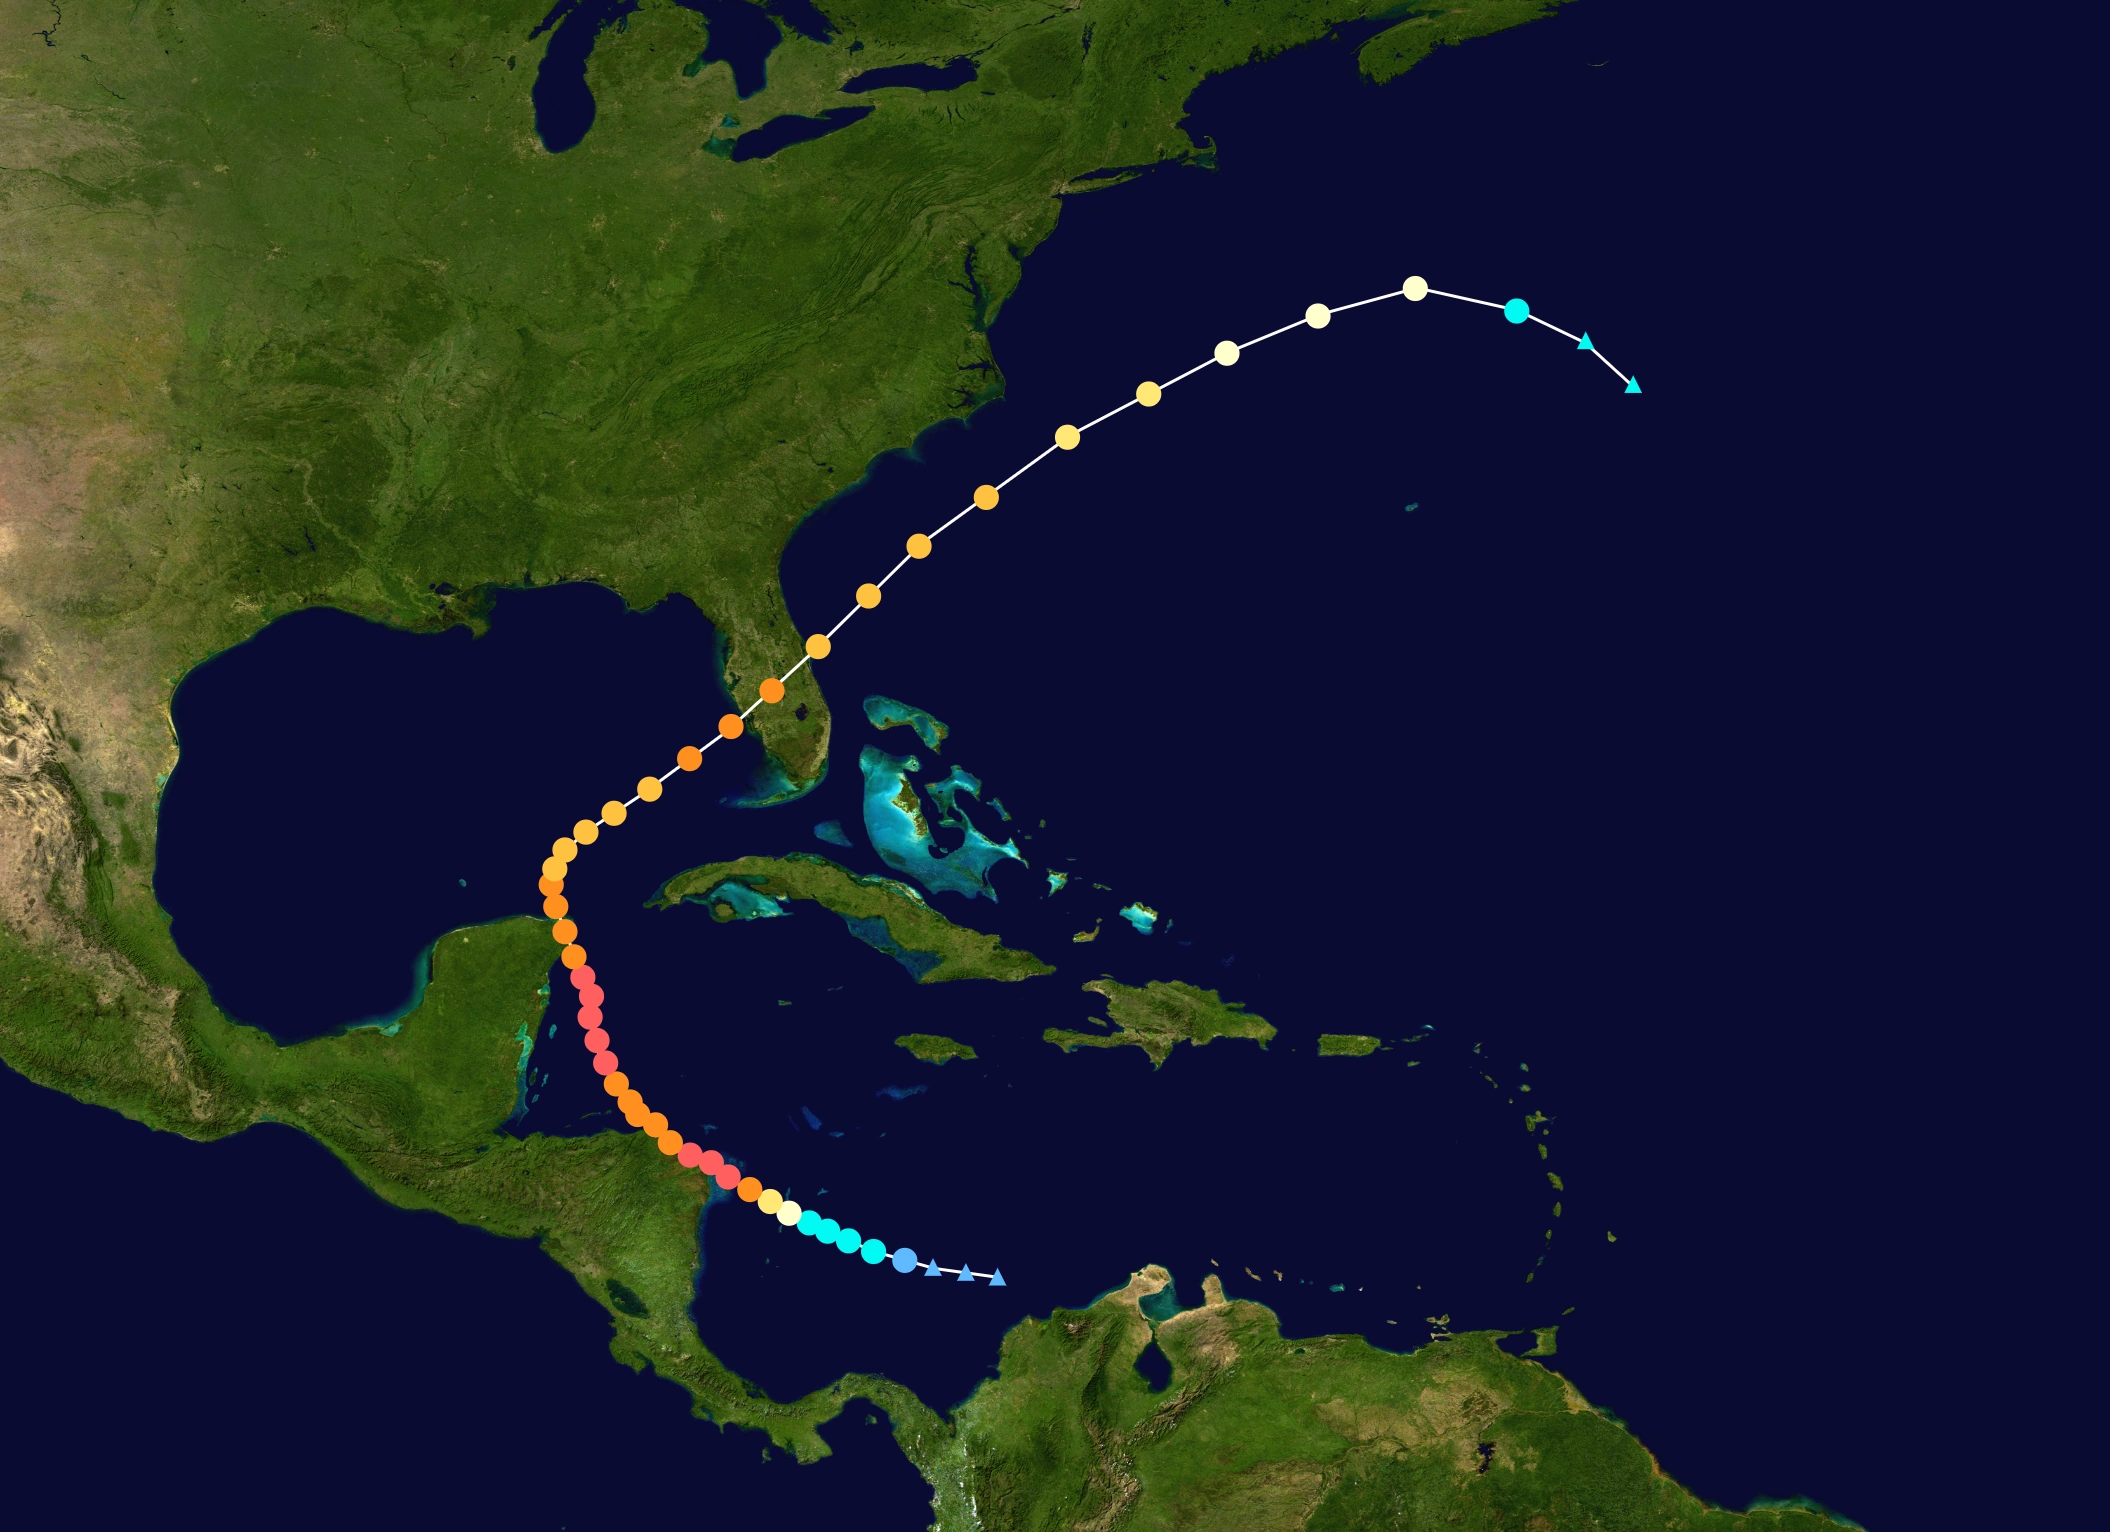 | |
| Duration | September 16 – September 26 |
|---|---|
| Peak intensity | 200 mph (325 km/h) (1-min) 881 mbar (hPa) |
Hurricane Van[]
Main Article: Hurricane Van (2055)
| Category 1 hurricane (SSHWS) | |
 | |
| Duration | September 21 – September 25 |
|---|---|
| Peak intensity | 80 mph (130 km/h) (1-min) 987 mbar (hPa) |
Hurricane Winona[]
Main Article: Hurricane Winona (2055)
| Category 2 hurricane (SSHWS) | |
 | |
| Duration | September 29 – October 5 |
|---|---|
| Peak intensity | 100 mph (155 km/h) (1-min) 959 mbar (hPa) |
Tropical Storm Alpha[]
Main Article: Tropical Storm Alpha (2055)
| Tropical storm (SSHWS) | |
 | |
| Duration | October 4 – October 6 |
|---|---|
| Peak intensity | 65 mph (100 km/h) (1-min) 985 mbar (hPa) |
Hurricane Beta[]
Main Article: Hurricane Beta (2055)
| Category 1 hurricane (SSHWS) | |
 | |
| Duration | October 7 – October 9 |
|---|---|
| Peak intensity | 75 mph (120 km/h) (1-min) 991 mbar (hPa) |
Hurricane Gamma[]
Main Article: Hurricane Gamma
| Category 2 hurricane (SSHWS) | |
 | |
| Duration | October 10 – October 26 |
|---|---|
| Peak intensity | 110 mph (175 km/h) (1-min) 960 mbar (hPa) |
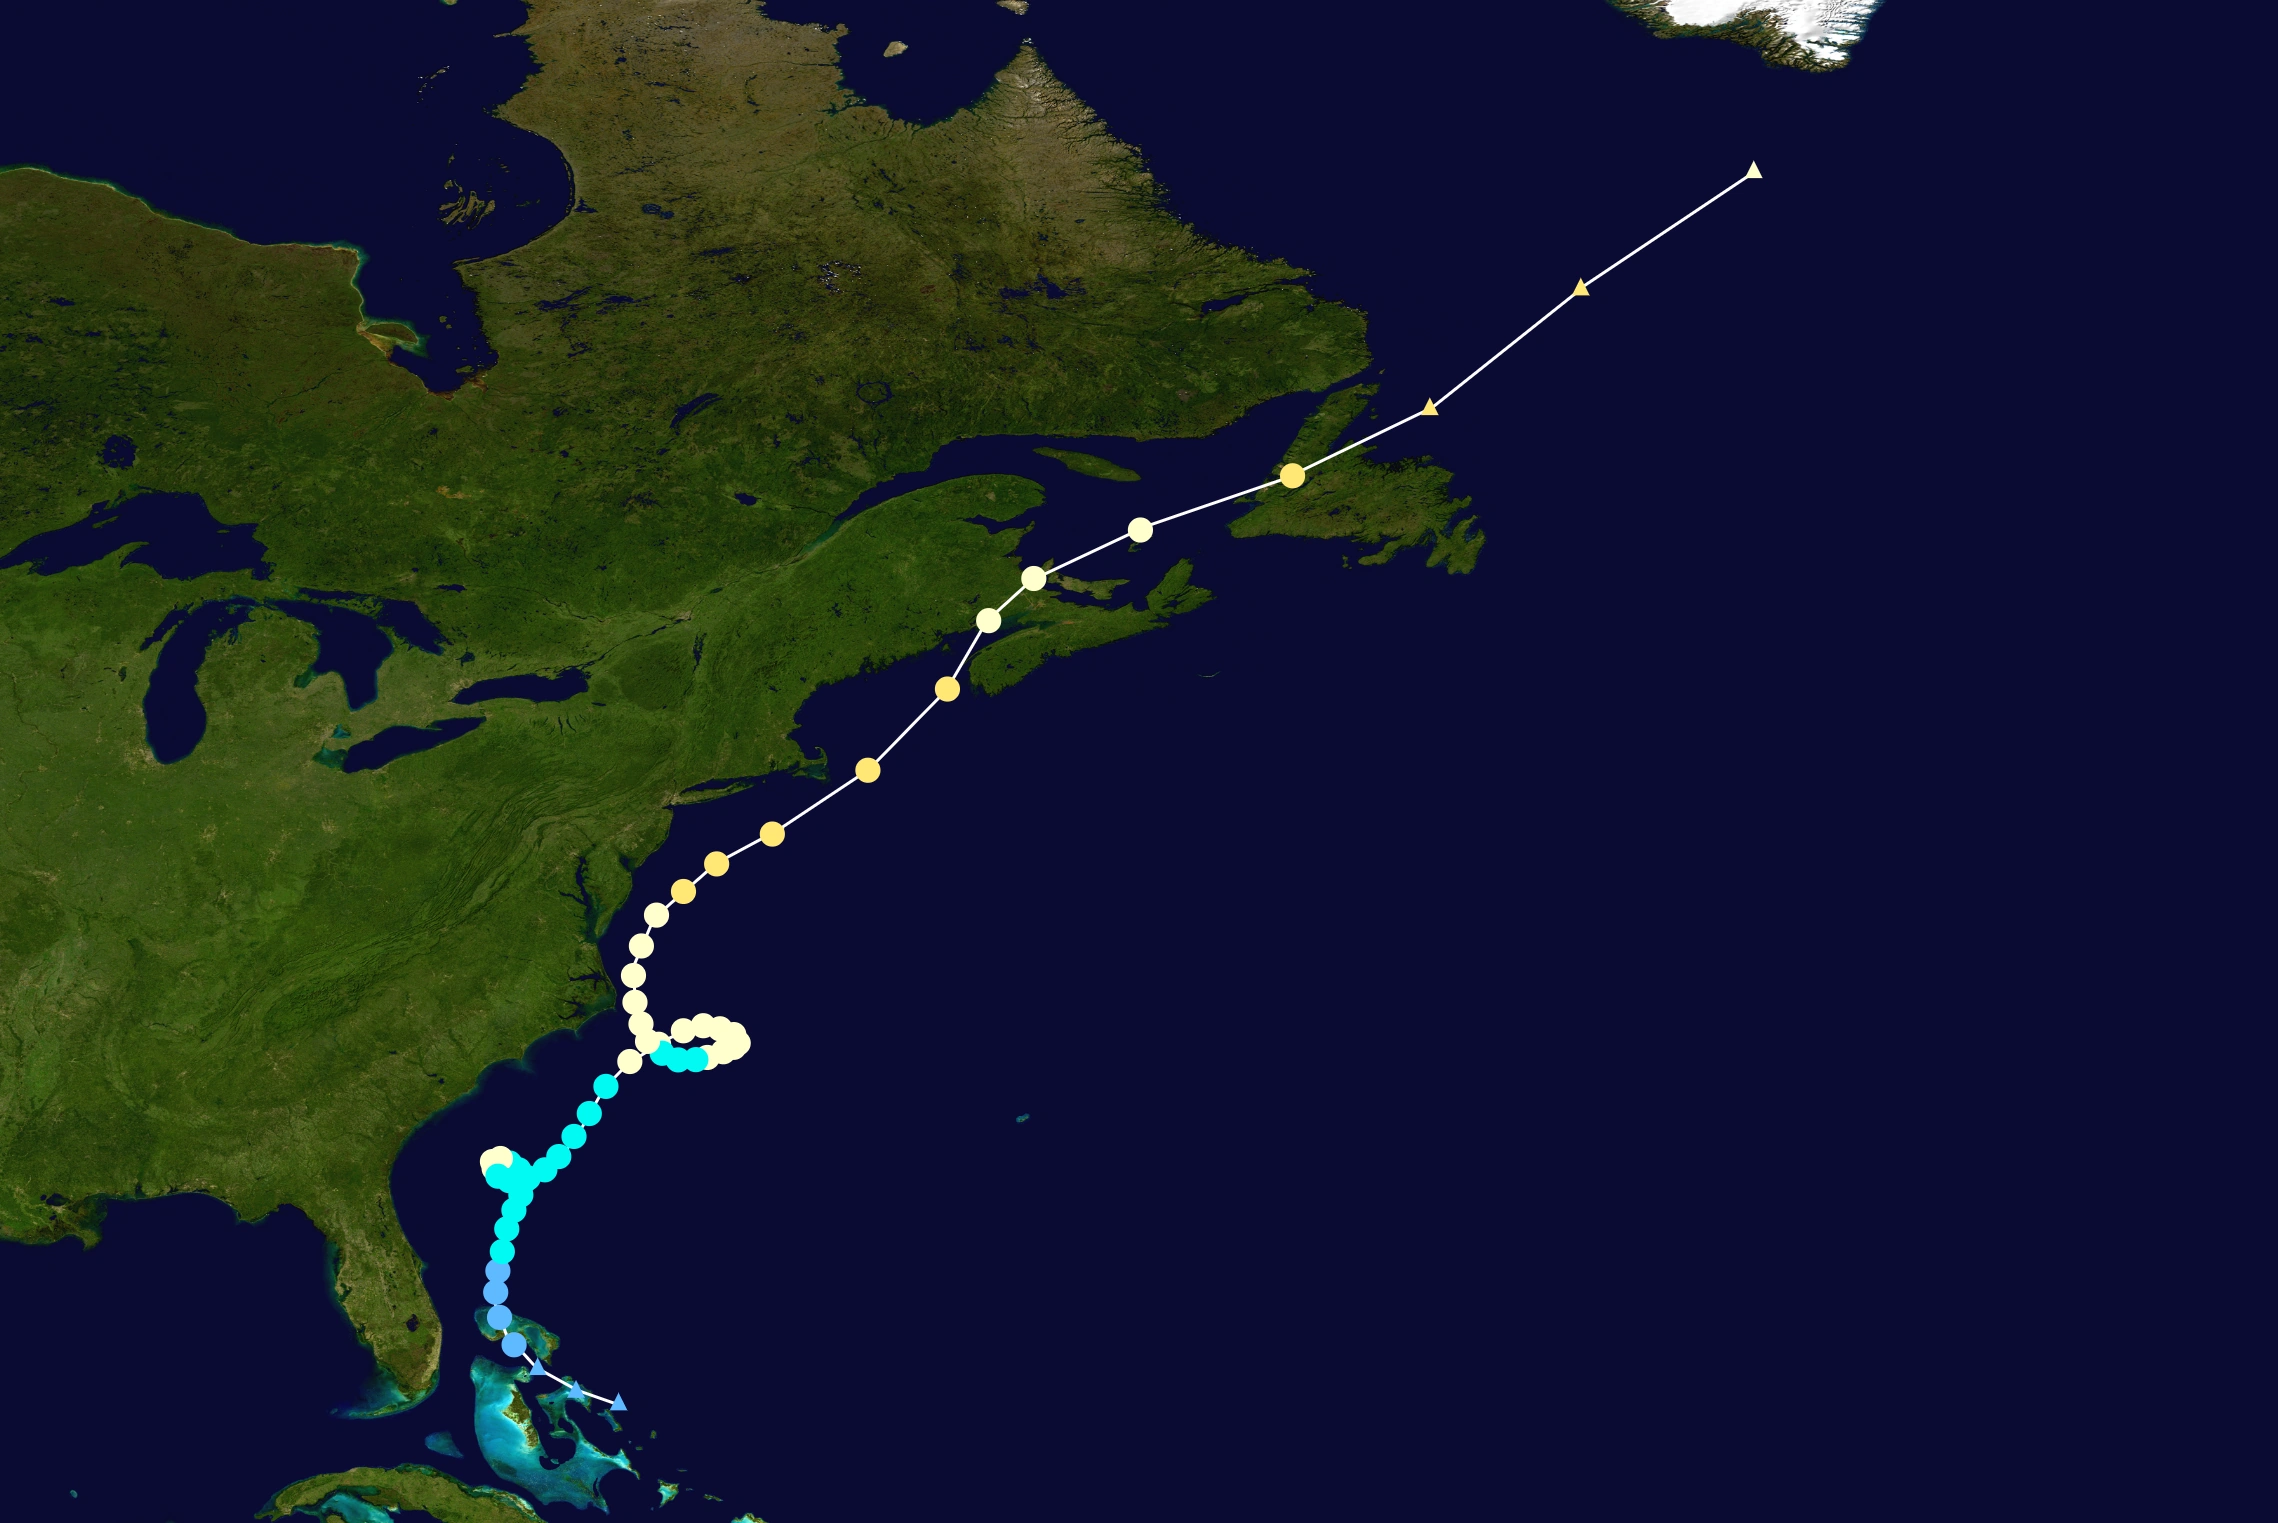
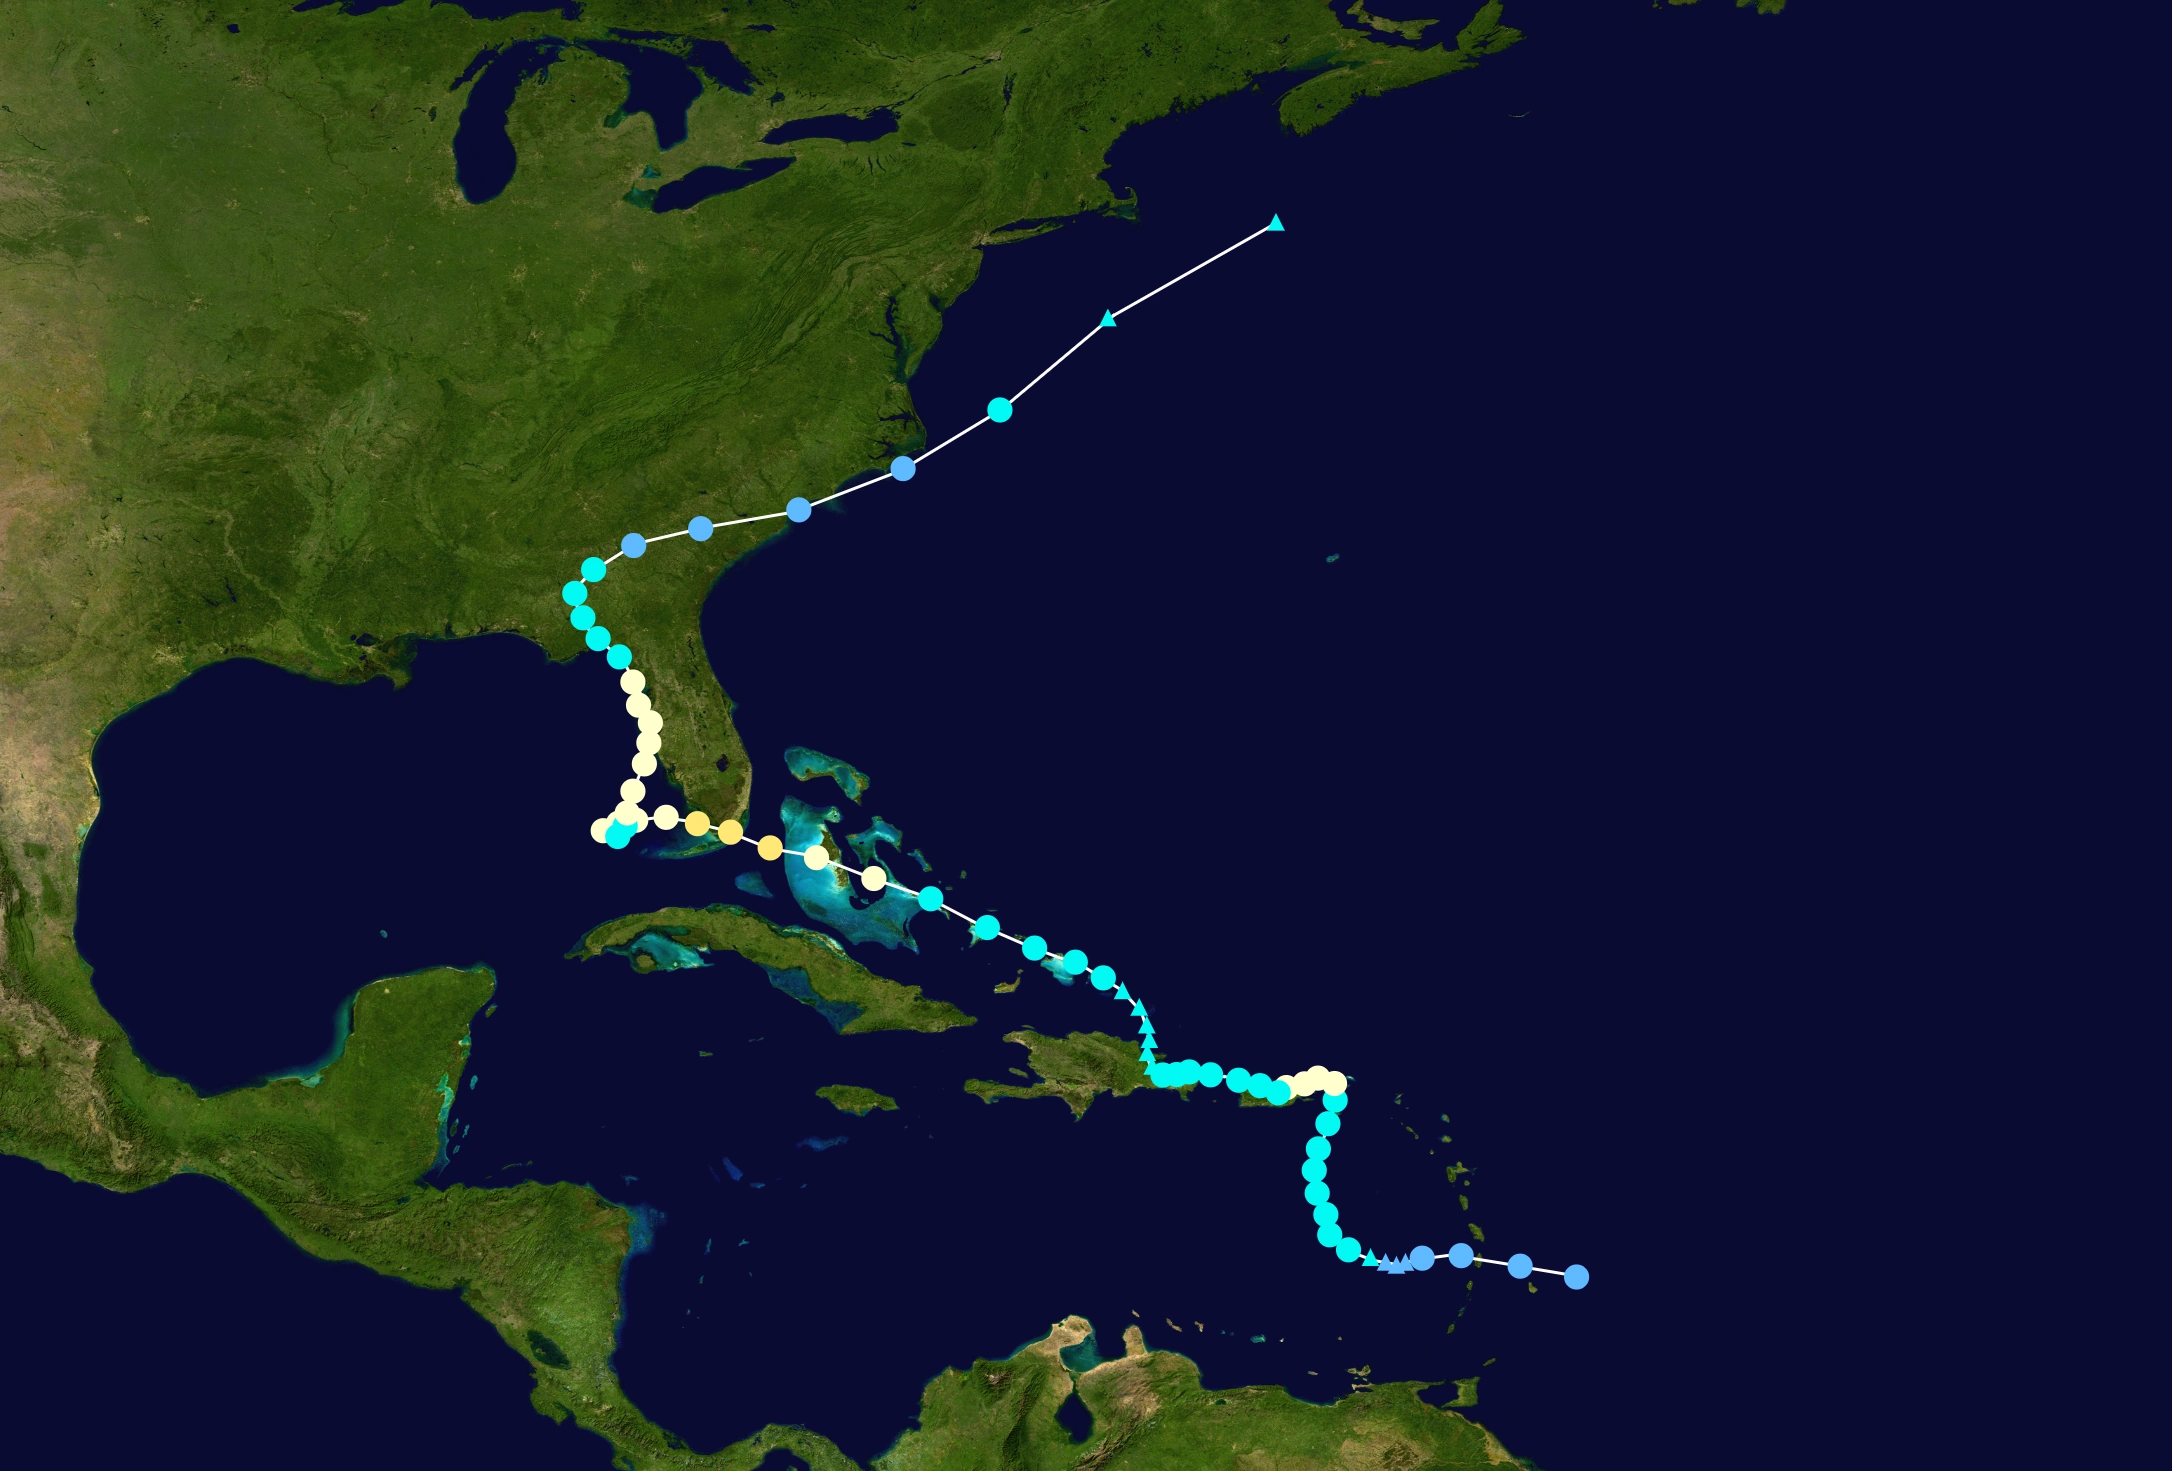
Hurricane Delta[]
Main Article: Hurricane Delta
See Also: Tropical Storm Kurumi (2055)
| Category 4 hurricane (SSHWS) | |
 | |
| Duration | October 12 – November 10 |
|---|---|
| Peak intensity | 130 mph (215 km/h) (1-min) 936 mbar (hPa) |
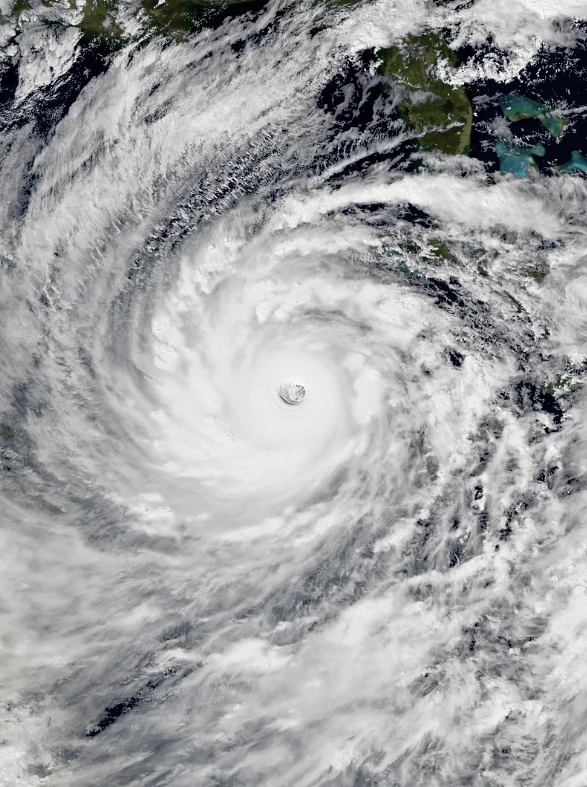
Hurricane Sonia[]
Main Article: Hurricane Sonia
| Category 5 hurricane (SSHWS) | |
 | |
| Duration | October 17 (Entered basin) – October 23 |
|---|---|
| Peak intensity | 160 mph (260 km/h) (1-min) 930 mbar (hPa) |
Tropical Depression Epsilon[]
Main Article: Tropical Depression Epsilon (2055)
| Tropical depression (SSHWS) | |
 | |
| Duration | October 17 – October 17 |
|---|---|
| Peak intensity | 35 mph (55 km/h) (1-min) 1013 mbar (hPa) |
Tropical Storm Zeta[]
| Tropical storm (SSHWS) | |
 | |
| Duration | October 25 – October 29 |
|---|---|
| Peak intensity | 60 mph (95 km/h) (1-min) 994 mbar (hPa) |
Subtropical Storm Eta[]
Main Article: Subtropical Storm Eta (2055)
| Subtropical storm (SSHWS) | |
 | |
| Duration | October 28 – October 30 |
|---|---|
| Peak intensity | 45 mph (75 km/h) (1-min) 993 mbar (hPa) |
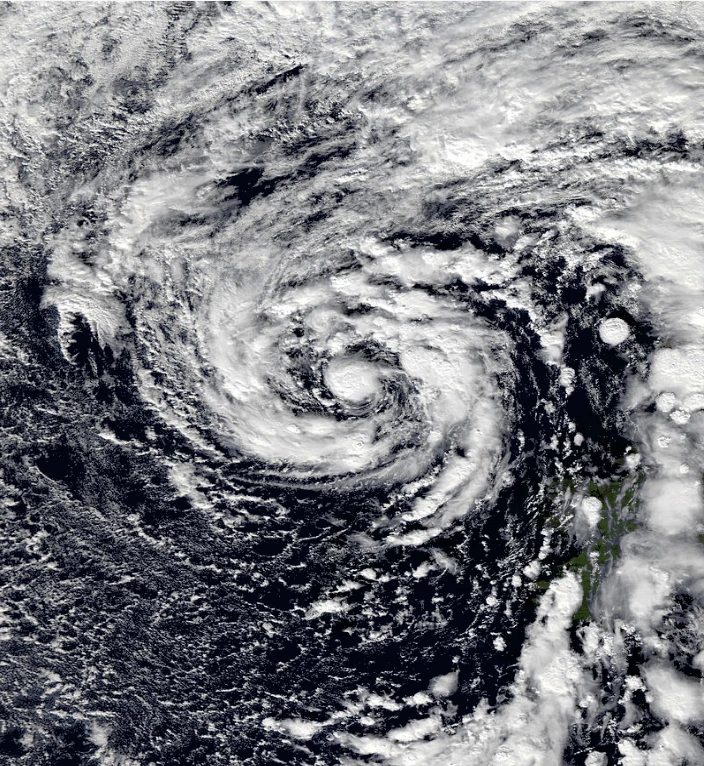
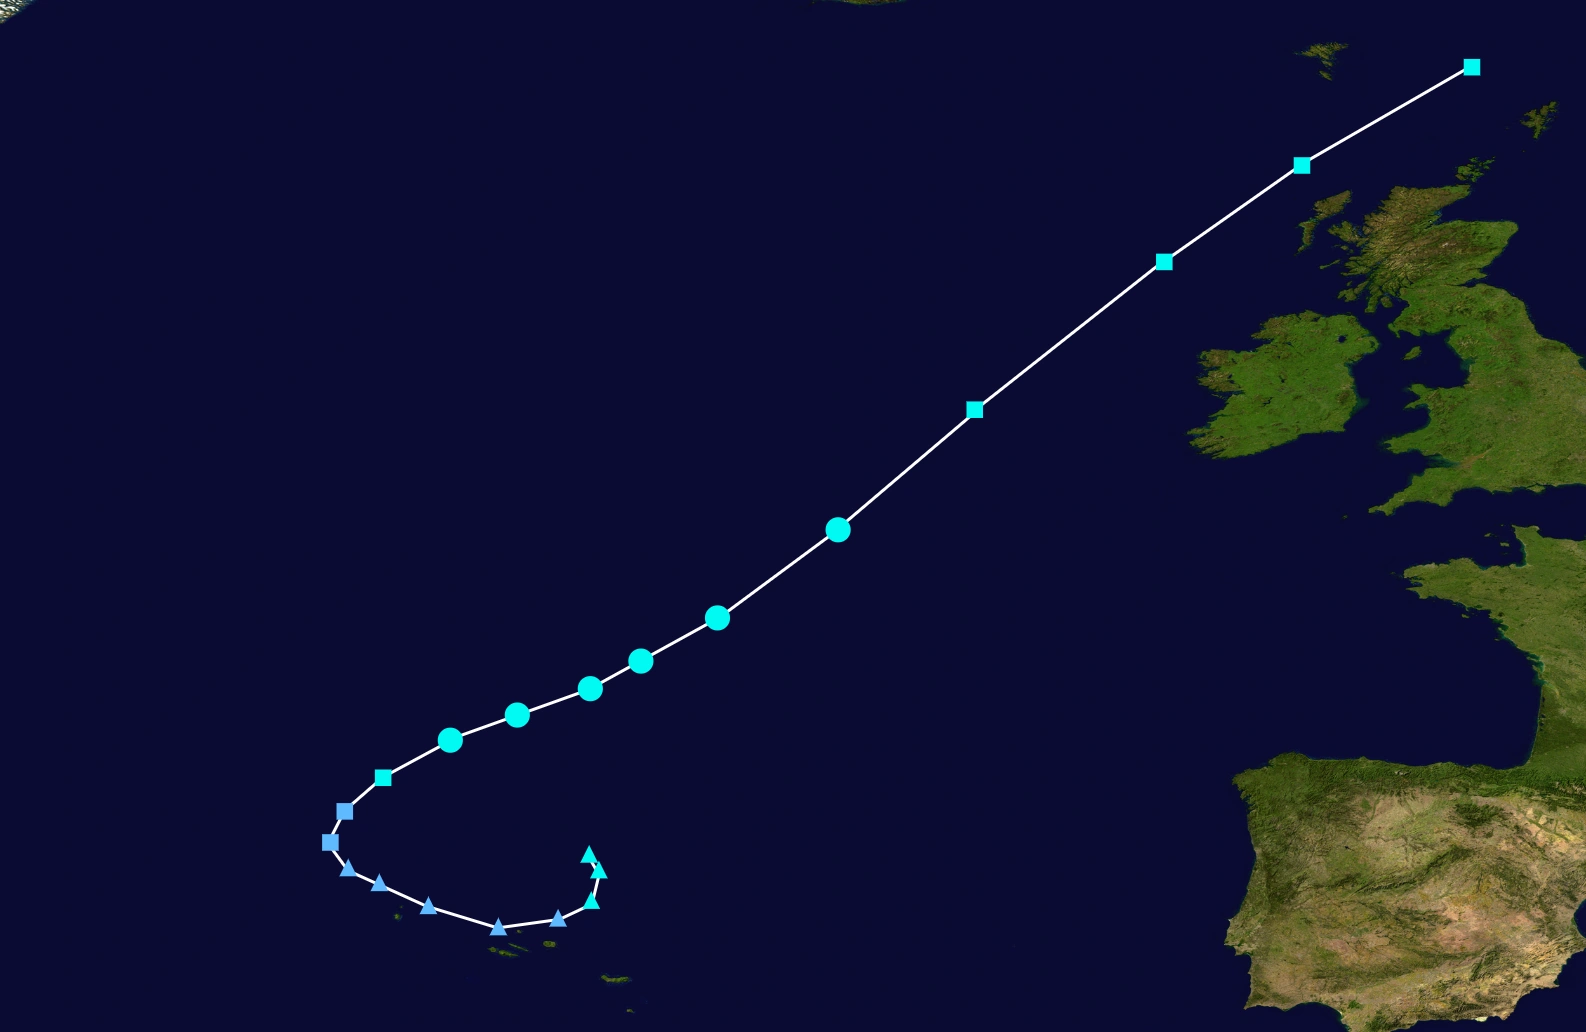
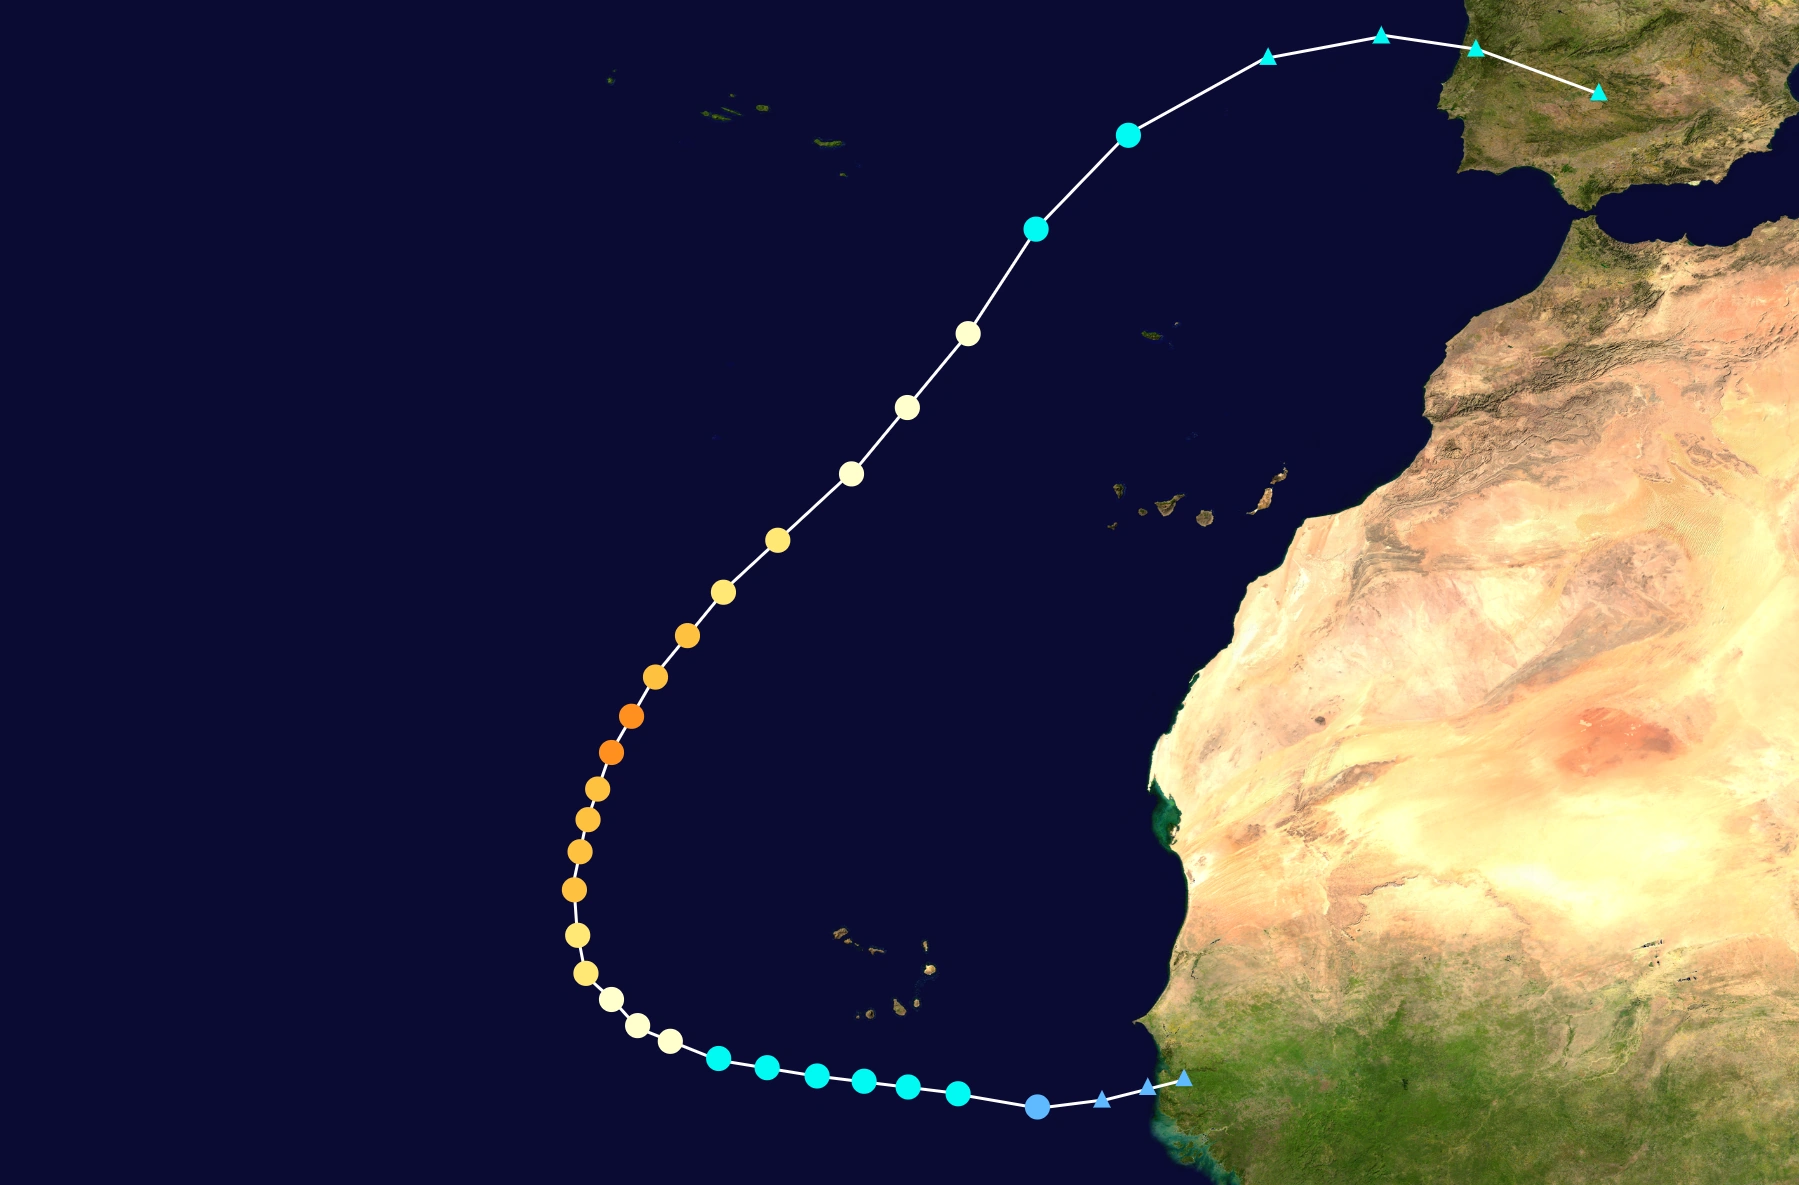
Hurricane Theta[]
Main Article: Hurricane Theta
| Category 4 hurricane (SSHWS) | |
 | |
| Duration | November 5 – November 8 |
|---|---|
| Peak intensity | 130 mph (215 km/h) (1-min) 954 mbar (hPa) |
Tropical Storm Iota[]
Main Article: Tropical Storm Iota (2055)
See Also: November 2055 North American Blizzard
| Tropical storm (SSHWS) | |
 | |
| Duration | November 14 – November 17 |
|---|---|
| Peak intensity | 65 mph (100 km/h) (1-min) 1002 mbar (hPa) |
Tropical Storm Kappa[]
Main Article: Tropical Storm Kappa (2055)
| Tropical storm (SSHWS) | |
 | |
| Duration | November 20 – November 21 |
|---|---|
| Peak intensity | 40 mph (65 km/h) (1-min) 1008 mbar (hPa) |
Tropical Storm Lambda[]
Main Article: Tropical Storm Lambda
| Tropical storm (SSHWS) | |
 | |
| Duration | November 28 – December 2 |
|---|---|
| Peak intensity | 70 mph (110 km/h) (1-min) 983 mbar (hPa) |
Hurricane Mu[]
Main Article: Hurricane Mu
| Category 1 hurricane (SSHWS) | |
 | |
| Duration | December 22 – December 26 |
|---|---|
| Peak intensity | 80 mph (130 km/h) (1-min) 981 mbar (hPa) |
Other System[]

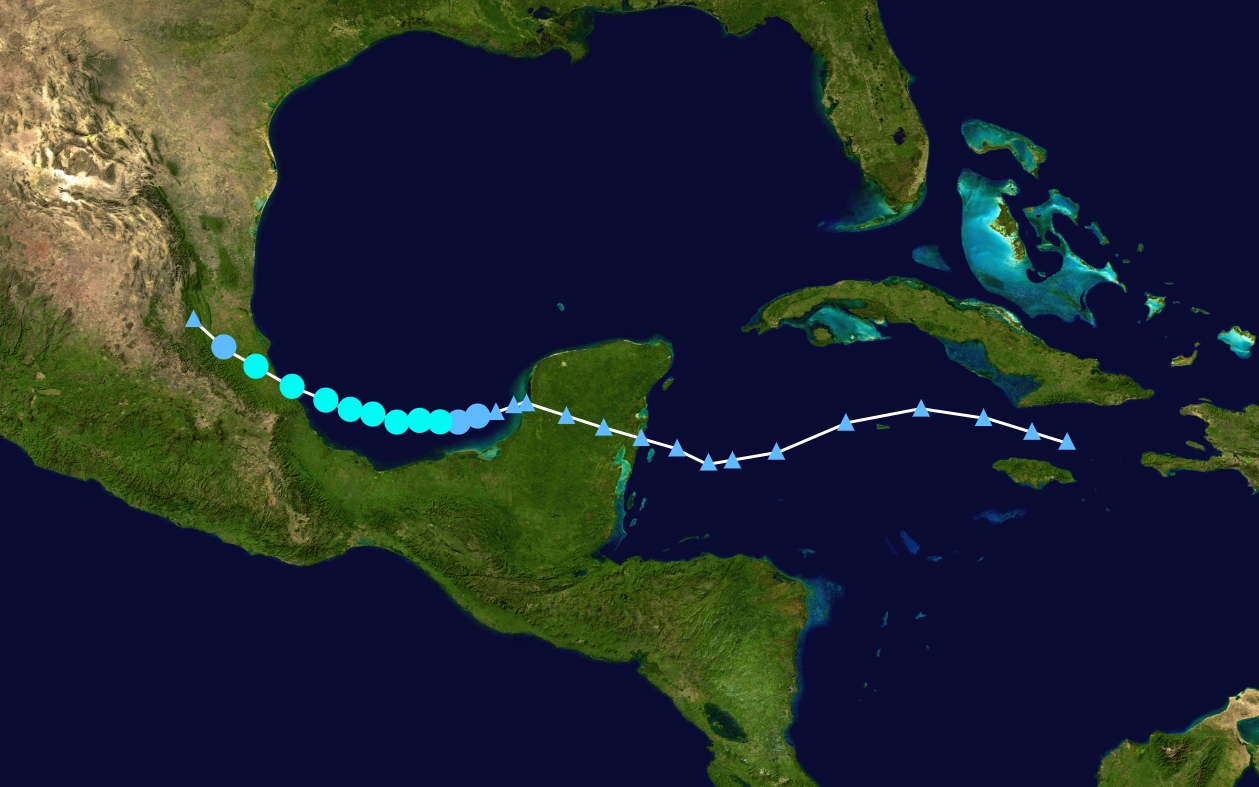
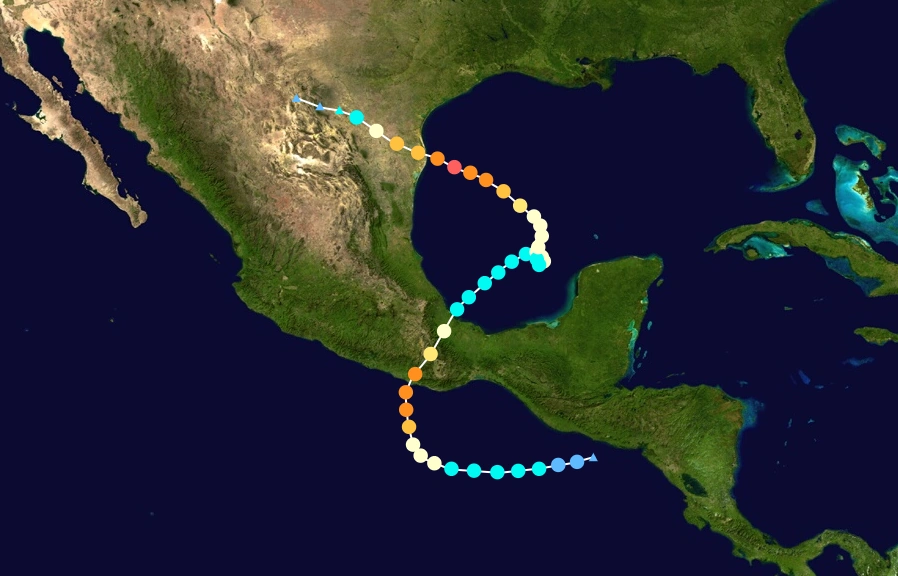
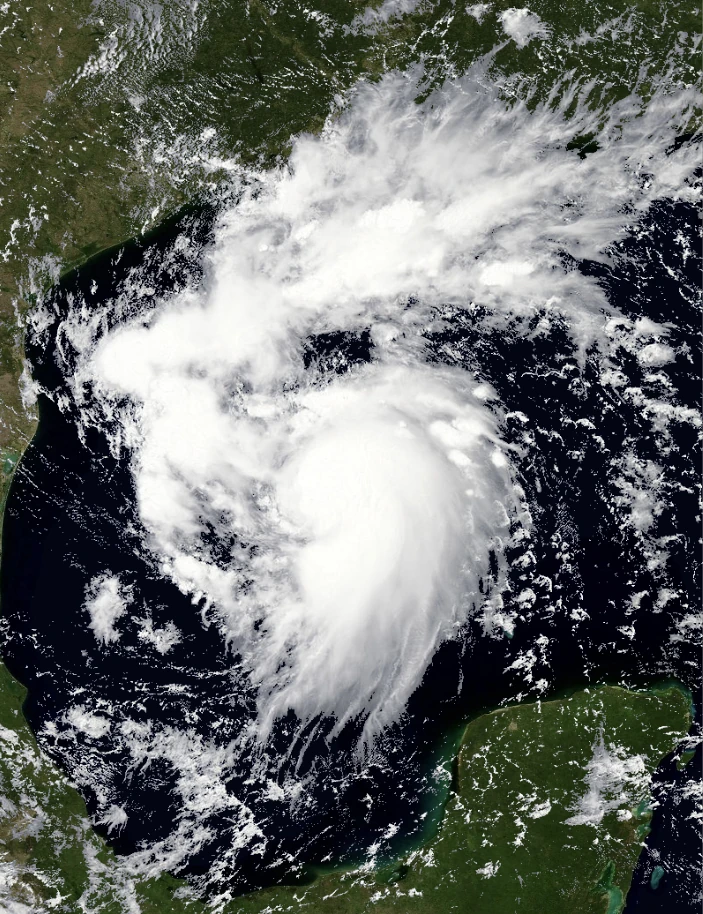
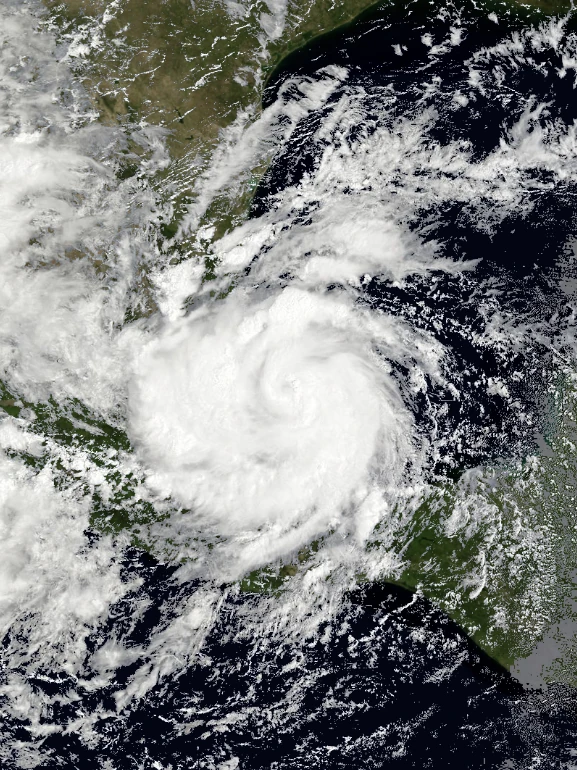
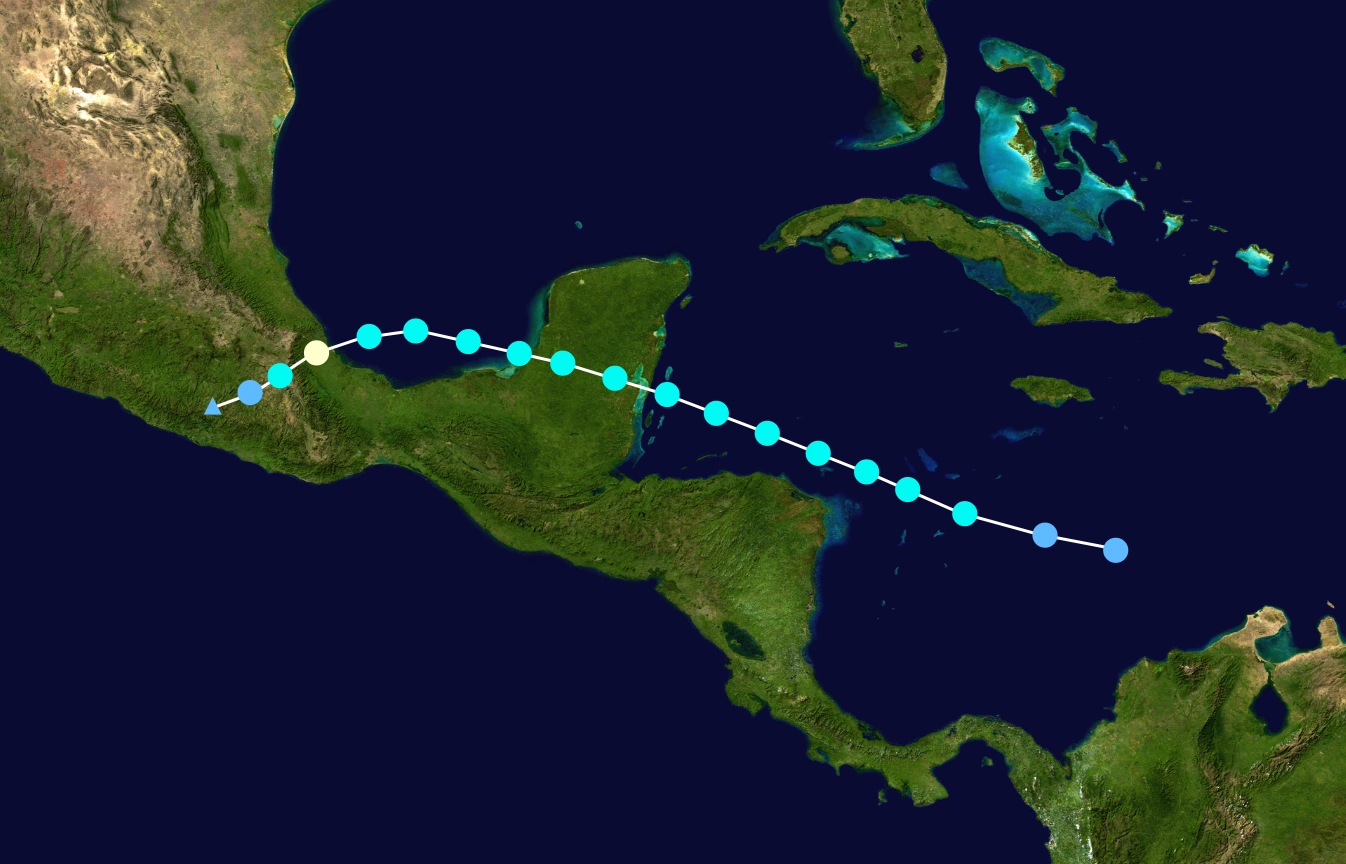
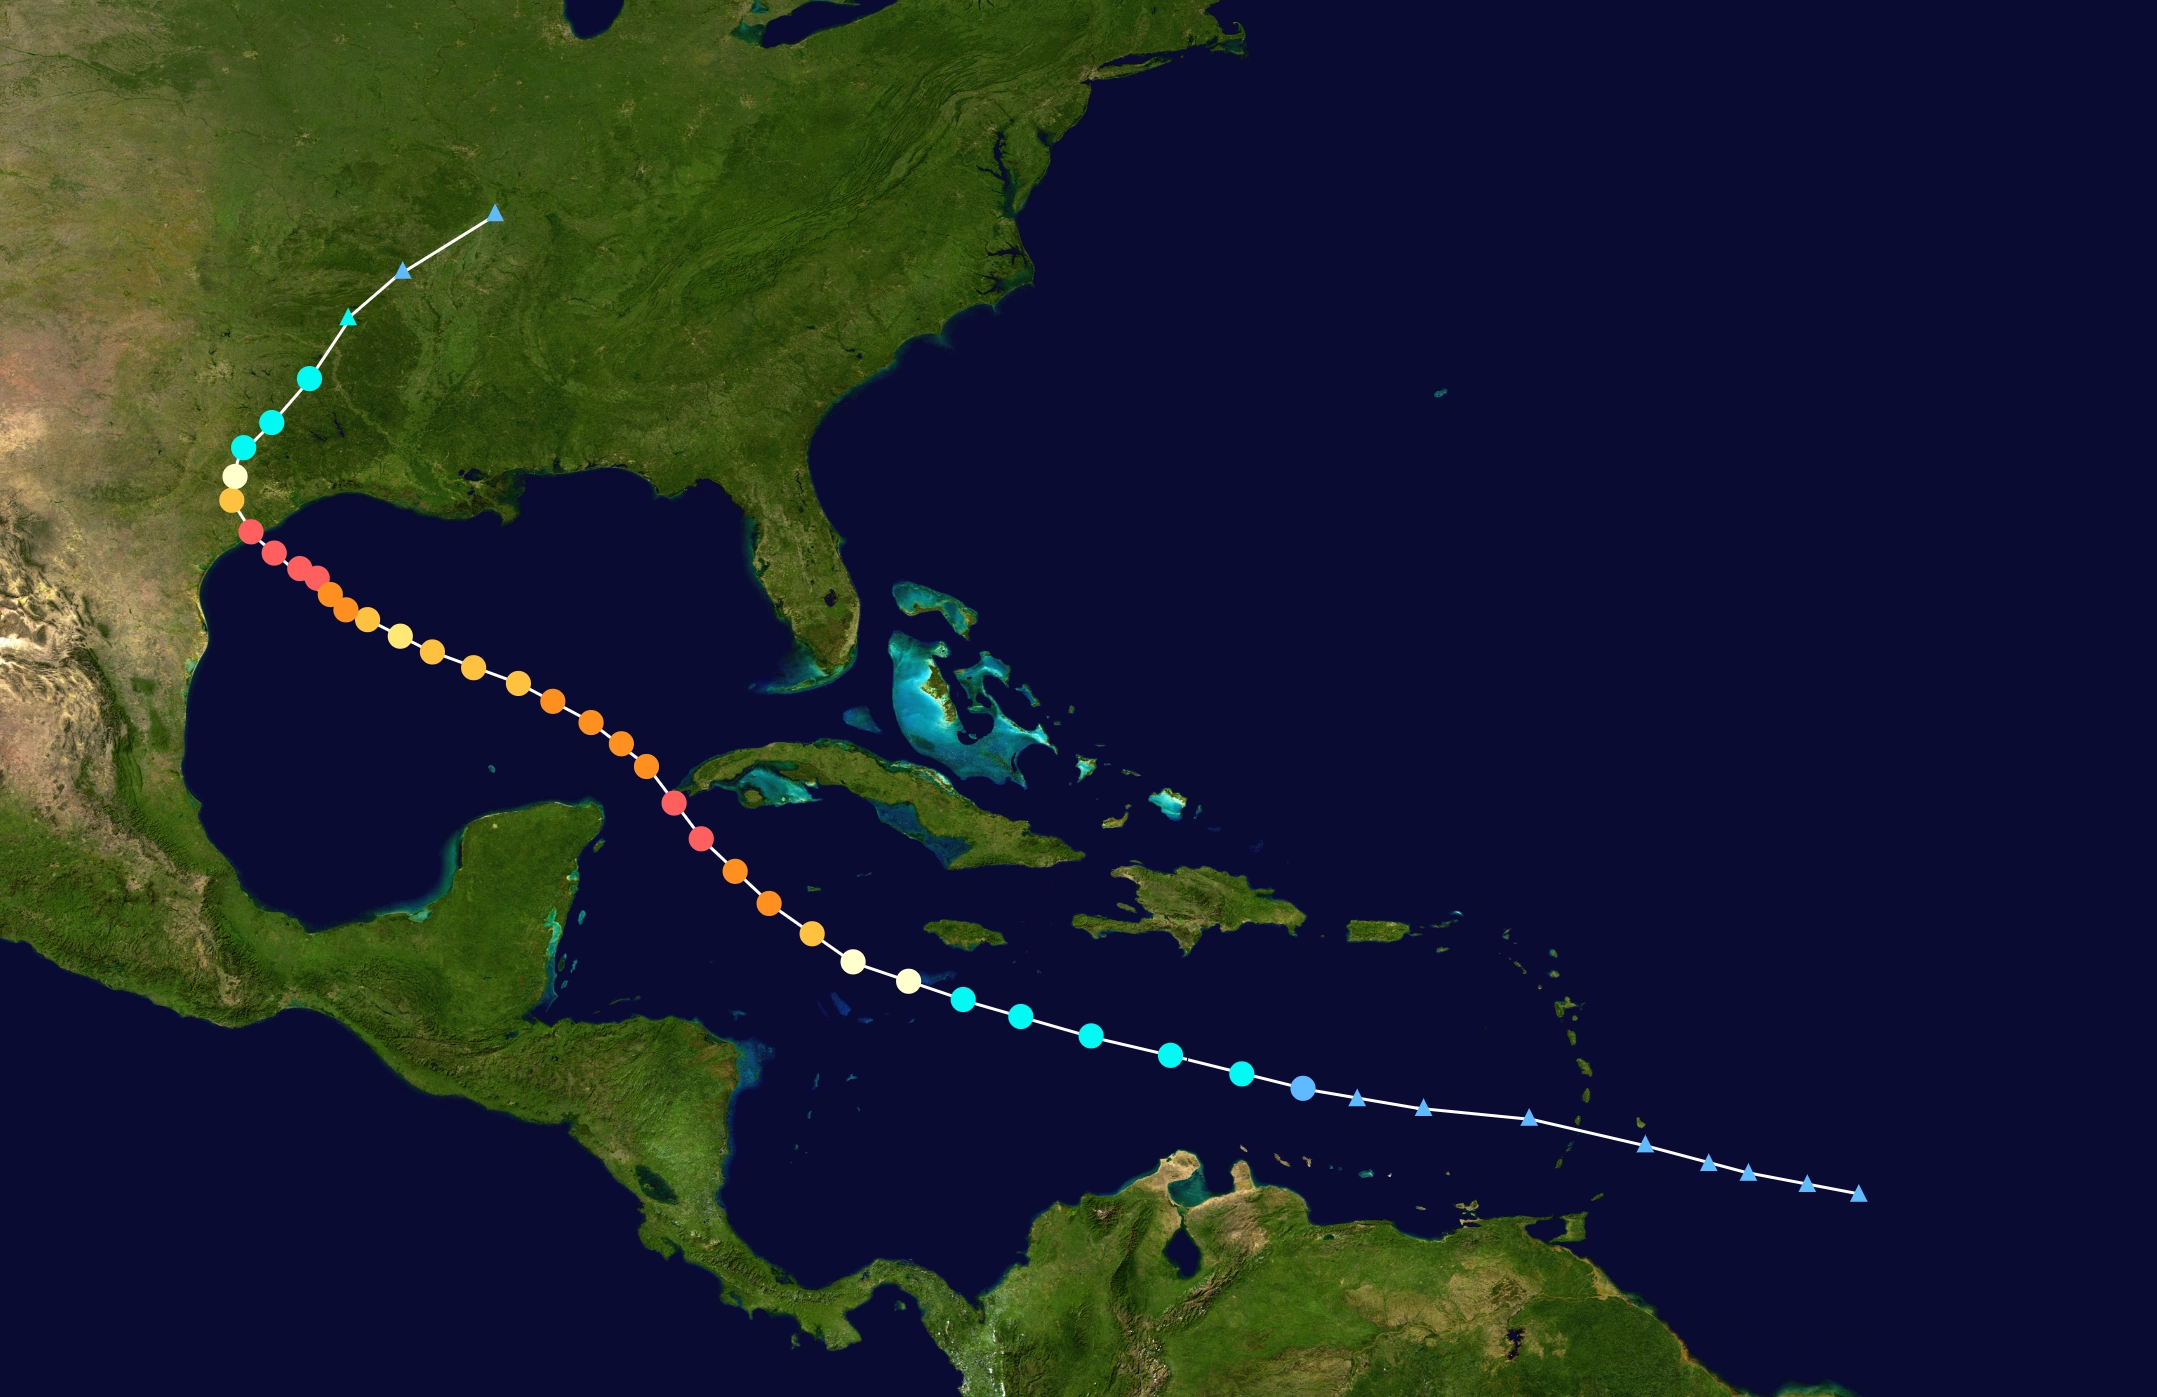
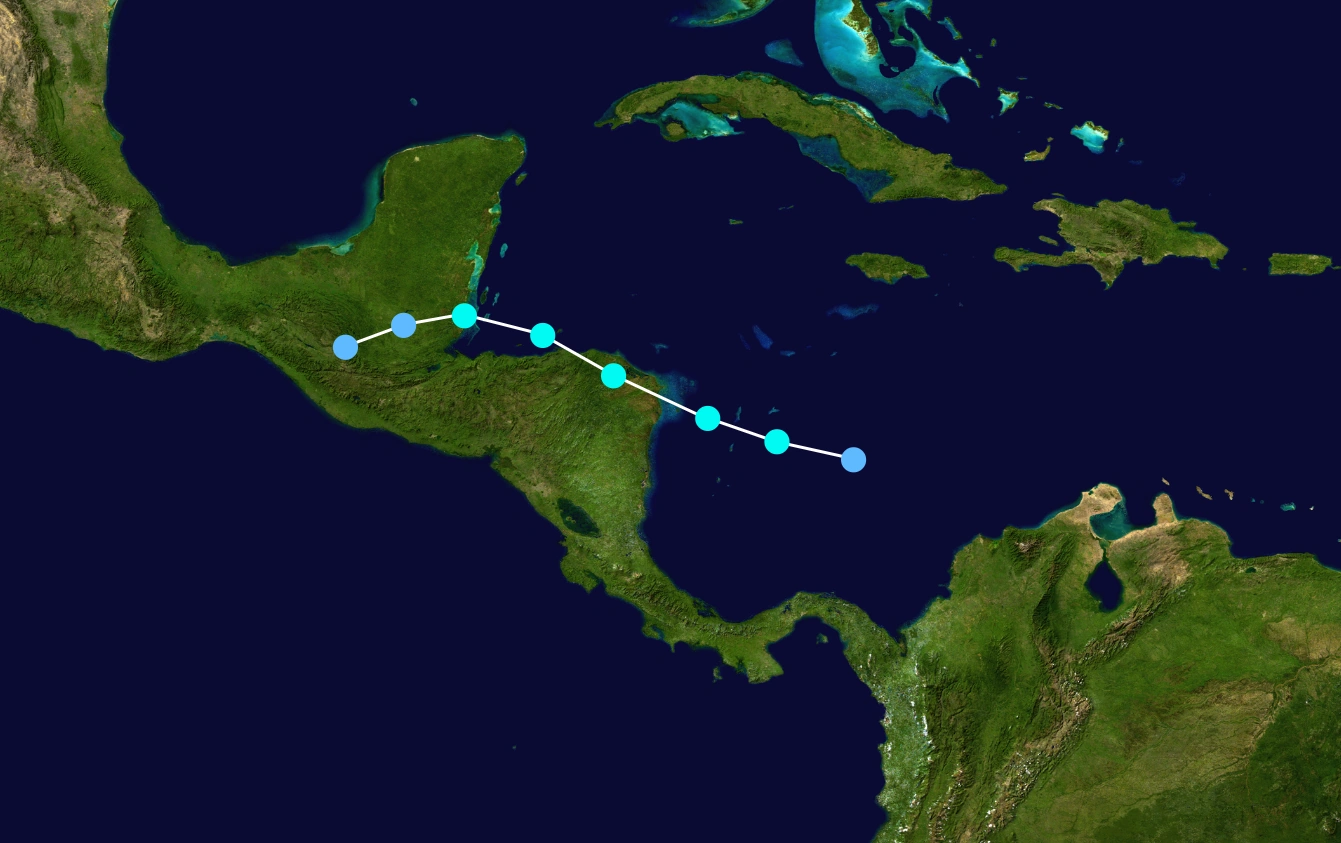
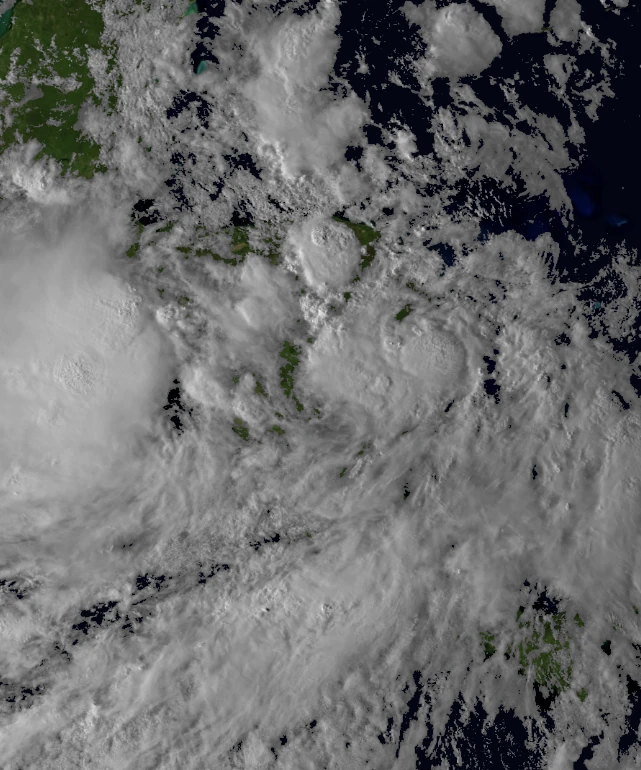
Potential Tropical Cyclone Nine on July 18 while approaching Central America.
A tropical wave emerged off the coast of Africa on July 7. The wave split into two parts, the northernmost one of which would eventually amount to Hurricane Georgia on July 15. The southern portion of the wave would develop somewhat over the next several days, eventually trekking into the Caribbean Sea on July 13 where most of it's development would take place. The cyclone would be designated Potential Tropical Cyclone Nine, late on July 16 while a moderate distance to the east of Honduras due to it's potential threat to Central America. Nine continued west, with repeated recon flights and examination of ASCAT passes in an attempt to find a closed circulation, to no avail. The near-cyclone would attain gale force winds on July 18 while coming off the Northeastern Honduras coast. The storm developed substancially between it's final reconnaissance flight (in the Atlantic) 2100 UTC July 17 and the estimated landfall time at 0600 UTC July 18. Post analysis did not upgrade Nine to a tropical cyclone as there was no way to confirm that the circulation had closed as the storm had lost any notable direct observation in order to assess a proper LLC. The system had achieved a 90% chance of formation before landfall. The system would emerge over the East Pacific basin where it would eventually form into the powerful and long lived Hurricane Beatrice, 4 days later.
Storm Names[]
The following list of names was used for named storms that formed in the North Atlantic in 2055. The names not retired from this list will be used again in the 2061 season. This was the same list used in the 2049 season, with the exception of the names Parker, Trinity and Winona which replaced Pablo, Tanya and Wendy. The names Parker, Trinity, Winona, Lambda and Mu were used for the first time this year.
A storm from the East Pacific basin crossed over while sustaining tropical cyclone status and therefore retained it's name, Sonia.
|
|
|
|
|
|
Retirement[]
On March 26, 2056, at the 78th session of the RA IV hurricane committee, the World Meteorological Organization retired the names ... from its rotating naming lists due to the number of deaths and amount of damage they caused, and they will not be used again for another Atlantic hurricane. They will be replaced with ... respectively, for the 2061 season. The WMO did not retire any names of the greek alphabet as it was ruled to be not practical to do so.
The name Sonia was also retired and replaced with Stella for the 2061 Pacific hurricane season, dealing significant damages in both the Atlantic and East Pacific basins.
Season Effects[]
This is a table of all the storms that formed in the 2055 Atlantic hurricane season. It includes their duration, names, affected areas, damages, and death totals. Deaths in parentheses are additional and indirect (an example of an indirect death would be a traffic accident), but were still related to that storm. Damage and deaths include totals while the storm was extratropical, a tropical wave, or a low, and all the damage figures are in 2017 USD. Potential tropical cyclones are not included in this table.
| Saffir–Simpson hurricane wind scale | ||||||
| TD | TS | C1 | C2 | C3 | C4 | C5 |
| Storm name |
Dates active | Storm category at peak intensity |
Max 1-min wind mph (km/h) |
Min. press. (mbar) |
Areas affected | Damage (USD) |
Deaths | |||
|---|---|---|---|---|---|---|---|---|---|---|
| One | March 1 – 2 | Subtropical depression | 35 (55) | 1009 | None | None | None | |||
| Andrea | April 16 – 17 | Subtropical storm | 45 (75) | 1003 | East Coast of the United States, New England, Nova Scotia | Minimal | None | |||
| Bryce | May 11 – 14 | Tropical storm | 65 (100) | 990 | Yucatan Peninsula, Cuba, Eastern United States | $94,650 | 4 | |||
| Chandra | May 28 – 31 | Category 1 hurricane | 75 (120) | 988 | Cuba, Eastern United States | $1.54 million | 5 (1) | |||
| Dominic | June 7 – 14 | Category 3 hurricane | 115 (185) | 968 | Lesser Antilles, Hispaniola, Puerto Rico, Bermuda, Atlantic Canada | Unknown | Unknown | |||
| Season aggregates | ||||||||||
| 5 systems | March 1 – Currently active | 200 (325) | 881 | > $1,644,650 | > 10 | |||||
See also[]
- 2056 Pacific hurricane season
- 2026 Pacific typhoon season
- 2032 North Indian Ocean cyclone season
- 2028-29 South-West Indian Ocean cyclone season
- 2024-25 Australian region cyclone season
- 2030-31 South Pacific cyclone season