FOR THE REVAMPED SEASON (WIP): CLICK HERE
ANIMATION: [1]
The 2023 Atlantic hurricane season was a costly and catastrophic season, inflicting $413.3 billion (USD) of damages, making it the costliest hurricane season on record until it was surpassed 4 years later, and caused a death toll of around 3,058. Most of those deaths and damages were caused by Katia, after submerging and completely wiping out the city of New Orleans. Some other destructive and deadly storms were Gert, which made landfall as a Category 5 hurricane twice in Florida, and Nigel, which caused flooding to the countries of Puerto Rico and the Dominican Republic due to its slow movement. It was a slightly above average season featuring 15 named storms, 8 hurricanes, and 4 major hurricanes. The season officially started on June 1 and officially ended on November 30, although storms may form out of those boundaries, as demonstrated by Tropical Storm Arlene, which formed on February 20.
Season summary[]

Systems[]
|
Subtropical Storm Arlene[]
| Subtropical storm (NHC) | |
  | |
| Duration | February 20 – February 21 |
|---|---|
| Peak intensity | 45 mph (75 km/h) (1-min) 998 mbar (hPa) |
An extratropical cyclone formed along a cold front early on February 18. Soon then that day, a low began to detach from the front, and acquired tropical storm force winds. On February 19, the system began to gradually develop, defining a center of circulation despite the high longitudes and cold waters. On February 20 at 1000 UTC, an Air Force Reconnaissance flight reported that the storm has a well-defined convention with winds reaching gale force, and thus it was classified as Subtropical Storm Arlene. However, Arlene remained a disorganized storm mainly due to moderate wind shear and cooler waters, peaking at 45 mph/998 mbar before weakening and becoming an extratropical cyclone the next day on February 21.
Tropical Depression Two[]
| Tropical depression (NHC) | |
  | |
| Duration | June 5 – June 7 |
|---|---|
| Peak intensity | 35 mph (55 km/h) (1-min) 1004 mbar (hPa) |
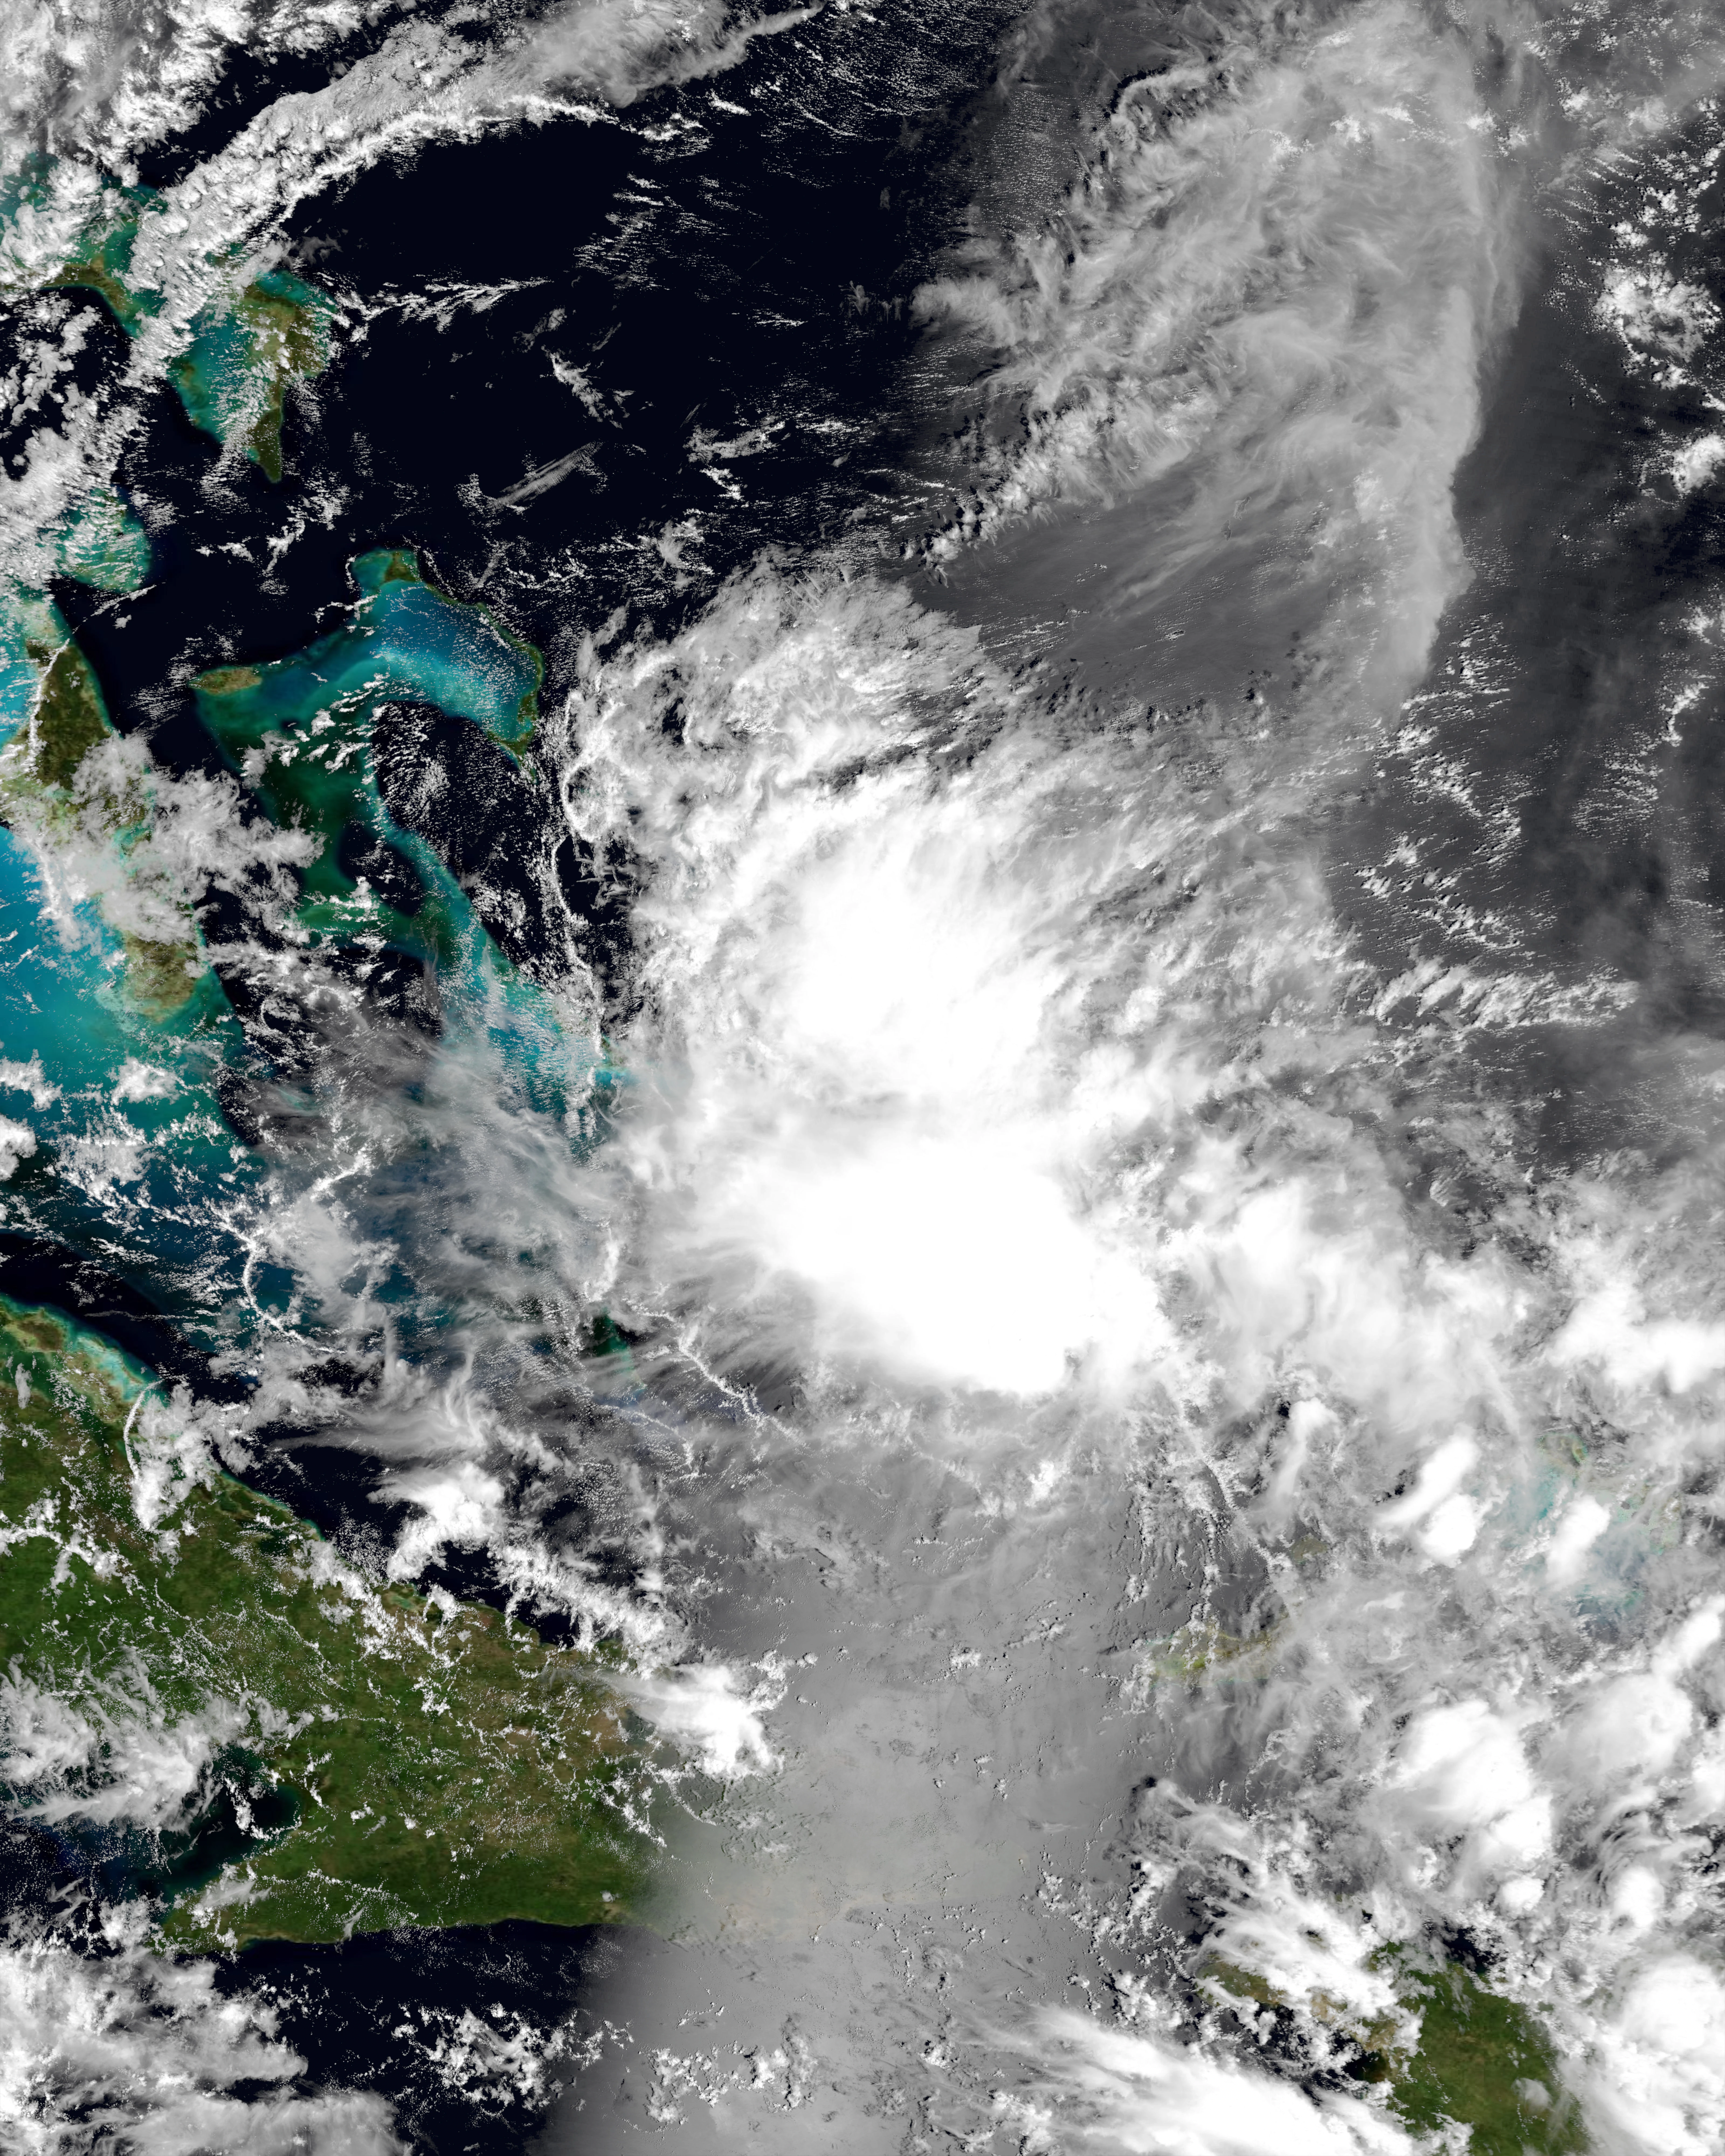
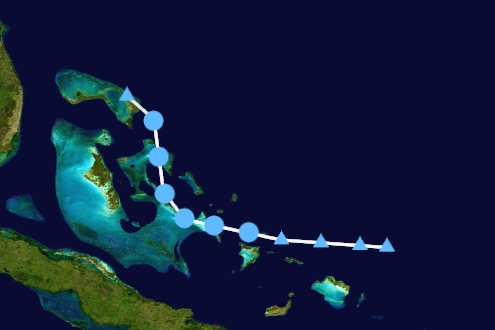
A tropical low formed on June 1, gradually moving westward and getting more organized. On June 4, the system developed a center of circulation and deep convection increased in the center, thus on the next day, the well-organized system was designated as a tropical depression while over the Bahamas. It was forecasted to be a tropical storm in a couple of days, however a sudden increase of wind shear prevented the storm from getting past tropical depression status. It peaked as a 35 mph/1004 mbar storm before getting sheared apart over the Bahamas while turning to the north and dissipating on June 7.
Hurricane Bret[]
| Category 1 hurricane (NHC) | |
  | |
| Duration | July 1 – July 6 |
|---|---|
| Peak intensity | 75 mph (120 km/h) (1-min) 982 mbar (hPa) |
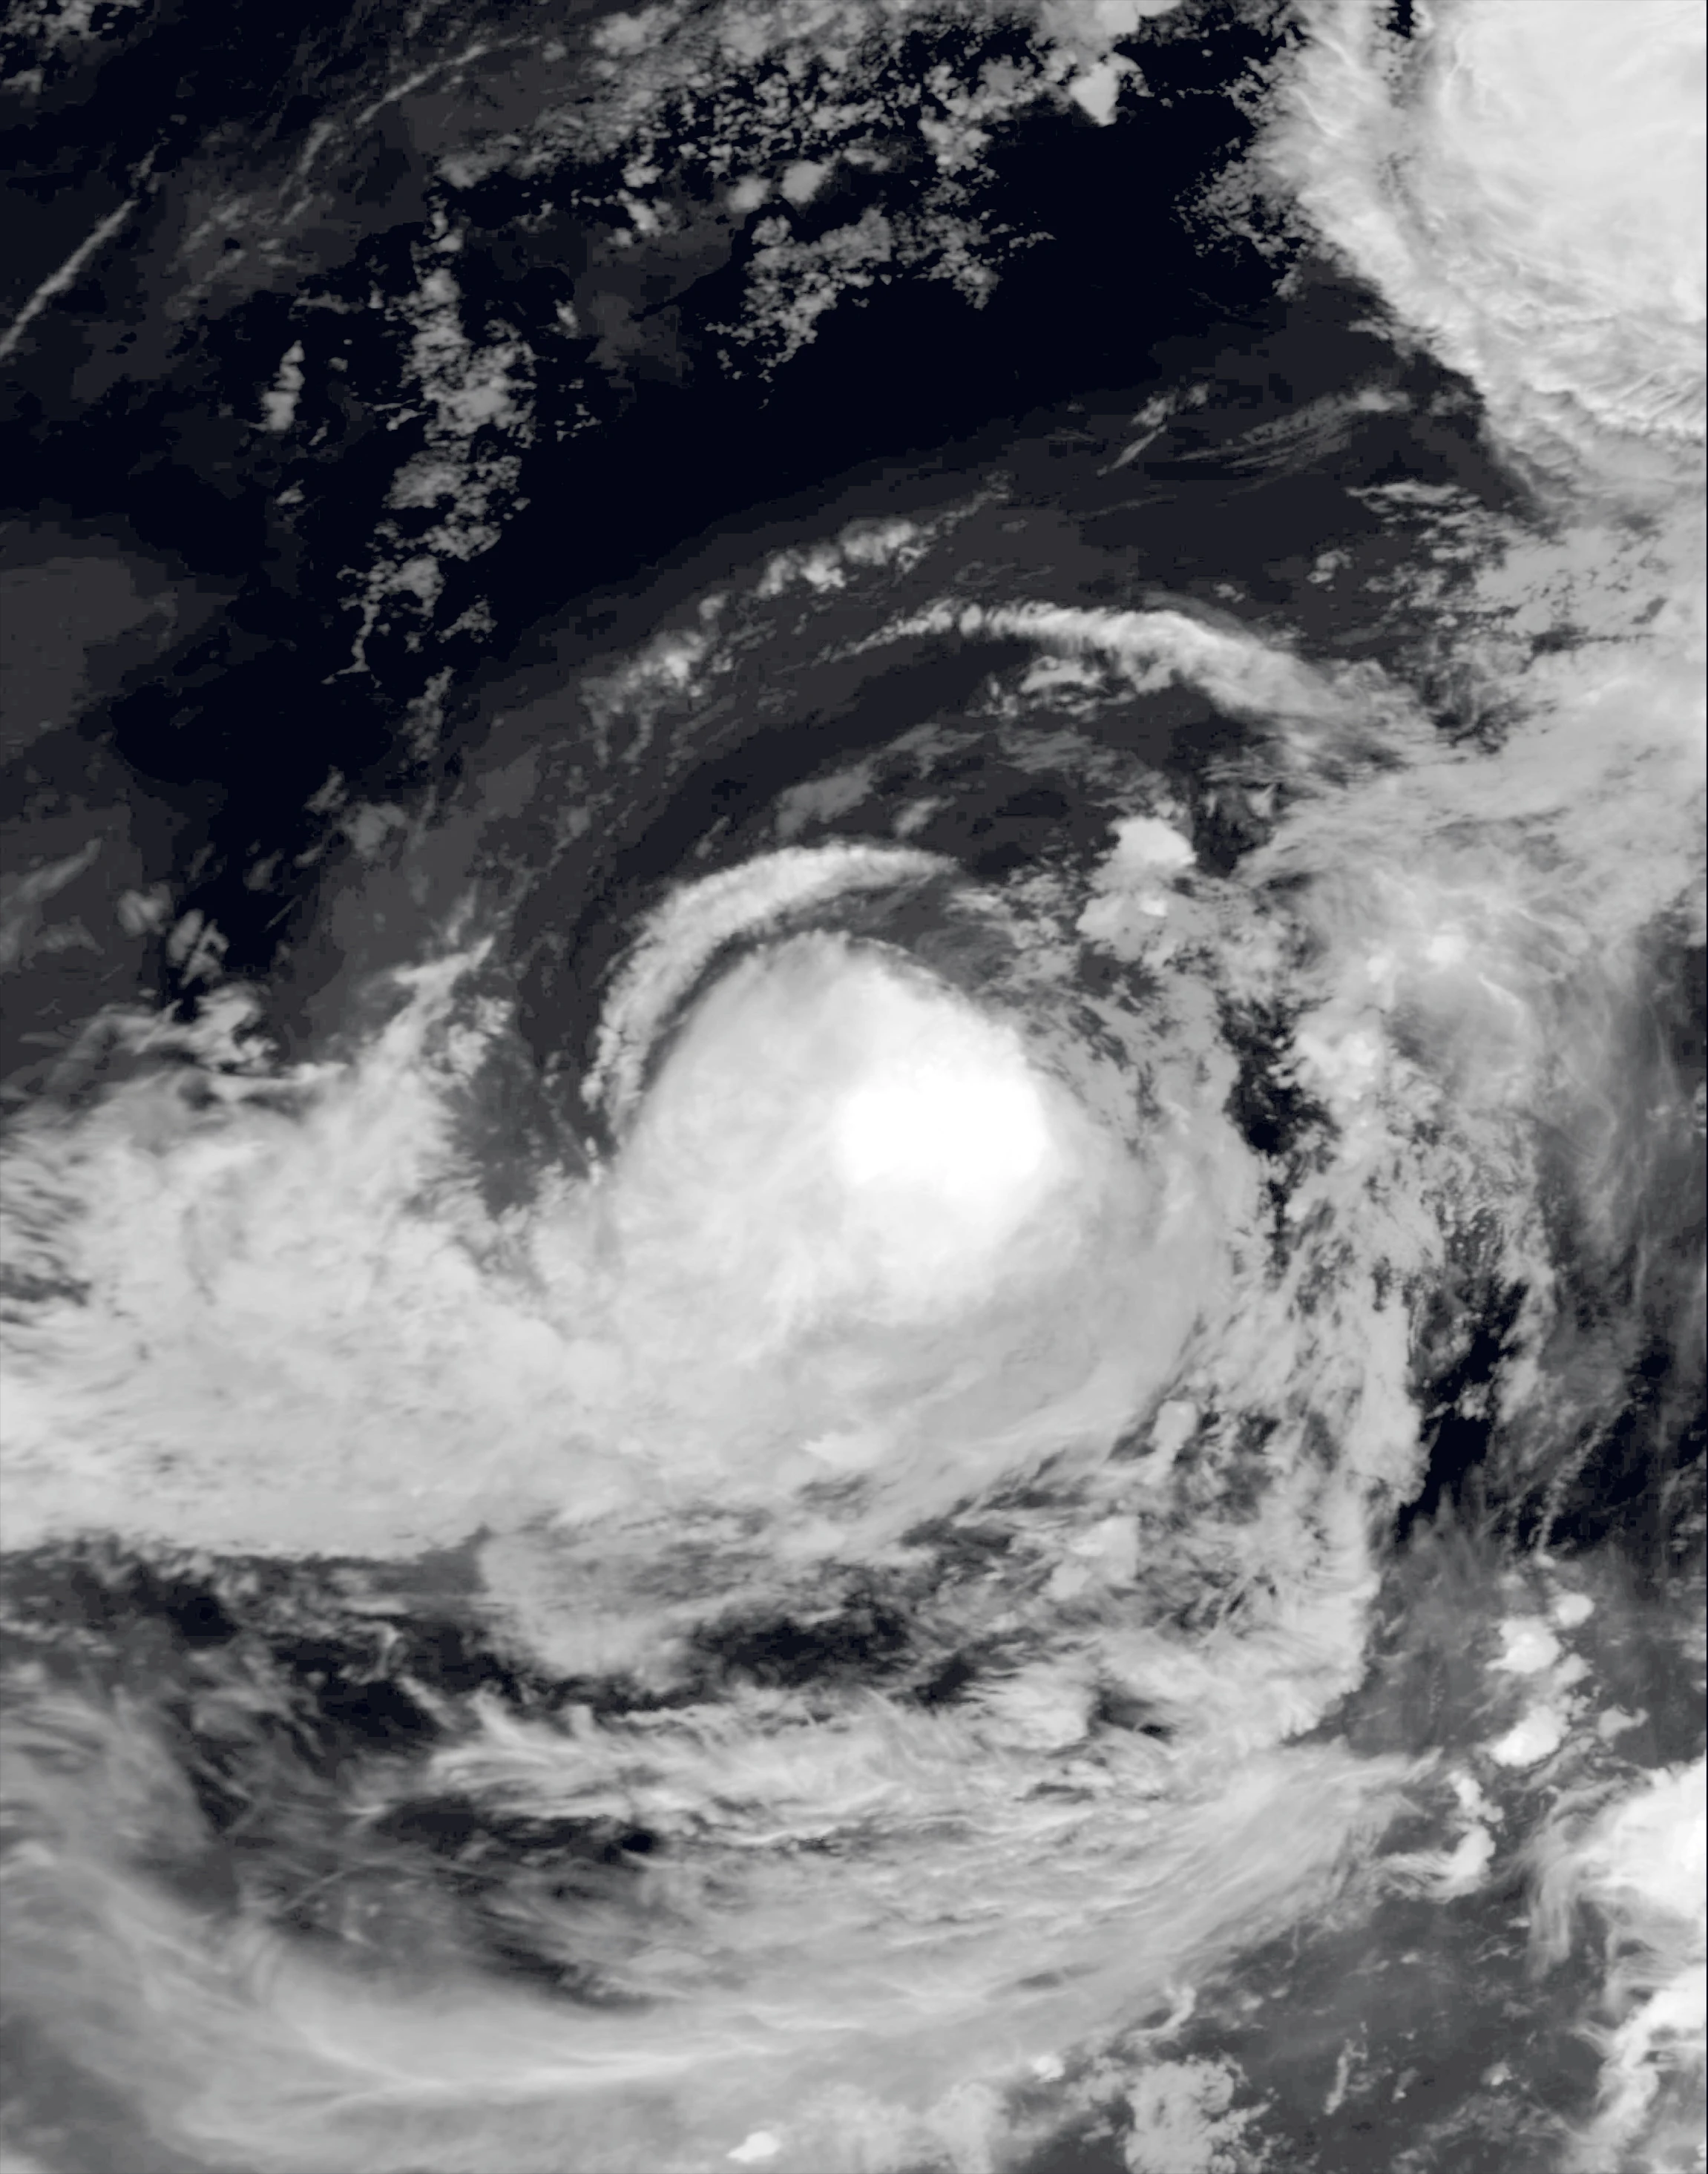
A non-tropical low formed in the open Atlantic in June 28 drifting west-northwest gradually. The NHC began to monitor the low the next day, for possible chances of development. Unexpectedly on July 1, it rapidly organized over colder waters and had began to develop tropical characteristics, and it prompted the NHC to upgrade it to a tropical depression at 0600 UTC. The depression continued to organize and on the next day, it was upgraded to Tropical Storm Bret. Bret further intensifies as it turns north into even cooler waters. Despite that, it managed to become a Category 1 hurricane on July 3 at 1200 UTC. It reached its peak intensity at that time, with maximum sustained winds of 75 mph (120 km/h) and a minimum central pressure of 982 mbar (hPa). A dozen hours later, it begin to have a Fujiwhara effect with nearby Tropical Storm Cindy, making a loop and weakening back to a tropical storm on July 4 at 0000 UTC. 30 hours later, it further weakened to a tropical depression and began to move straight west because the Fujiwhara effect is over for the storm. It continued to very gradually weaken until July 6 at 1200 UTC when it turned post-tropical.
Tropical Storm Cindy[]
| Tropical storm (NHC) | |
  | |
| Duration | July 3 – July 5 |
|---|---|
| Peak intensity | 40 mph (65 km/h) (1-min) 1005 mbar (hPa) |
A frontal system emerged off the east coast of the United States, gradually going westward. The NHC began monitoring for a potential development out of this frontal system on June 30. An area of convection detached from that system late on July 1, now gradually organizing and going northwestward. It had began to acquire gale-force winds more than halfway around the center of the storm, and had began to develop a center of circulation, thus it prompted the NHC to make it a tropical depression on July 3 at 0600 UTC. It continued to organize, intensifying into Tropical Storm Cindy early on July 4. However, with the interaction with the nearby Hurricane Bret, the storm didn’t intensify further. Despite the Fujiwhara Effect which propelled Cindy to make a U shape, it managed to hold on to tropical storm strength for a full day, peaking at 40 mph/1005 mbar before finally weakening to a tropical depression on July 5 at 0000 UTC. 18 hours later, it became a post-tropical cyclone, while going north-northwest.
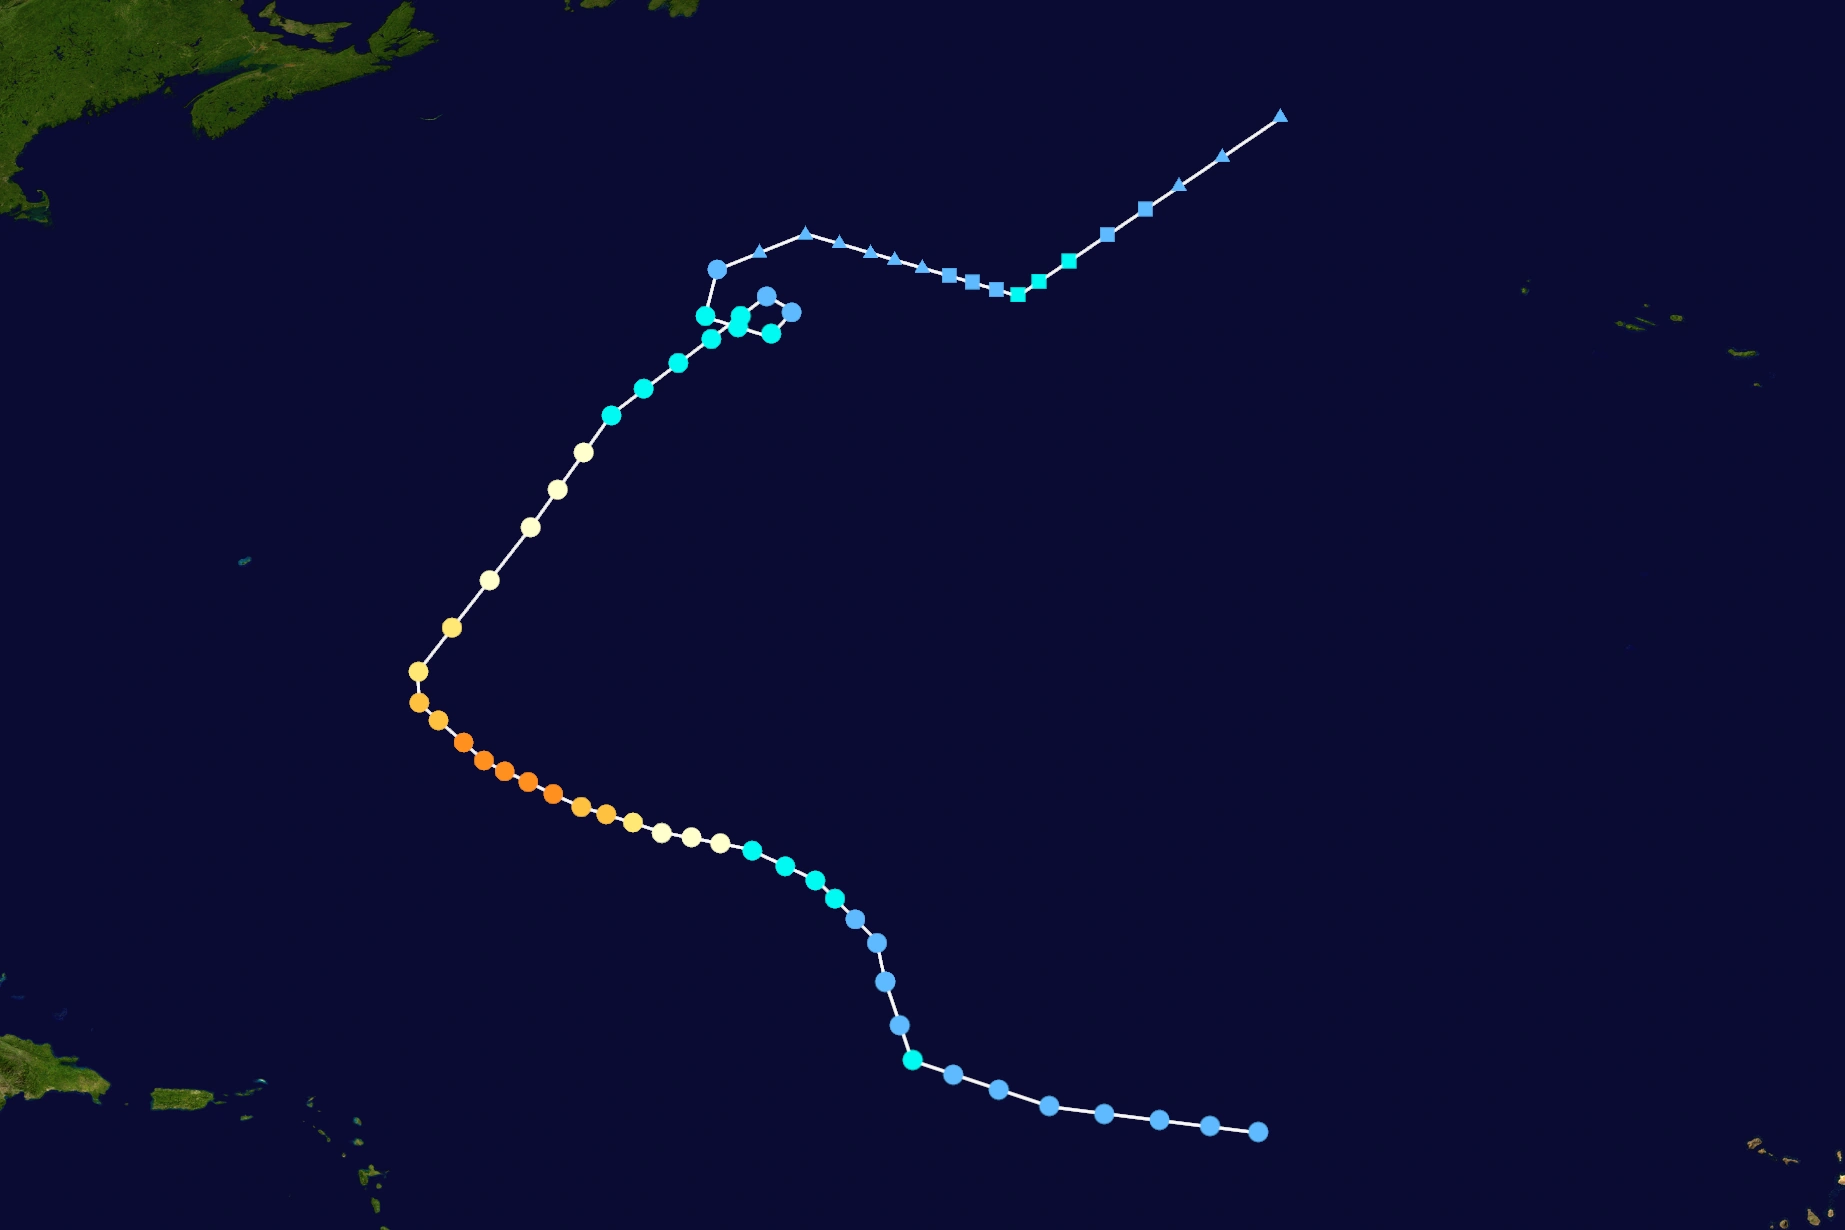
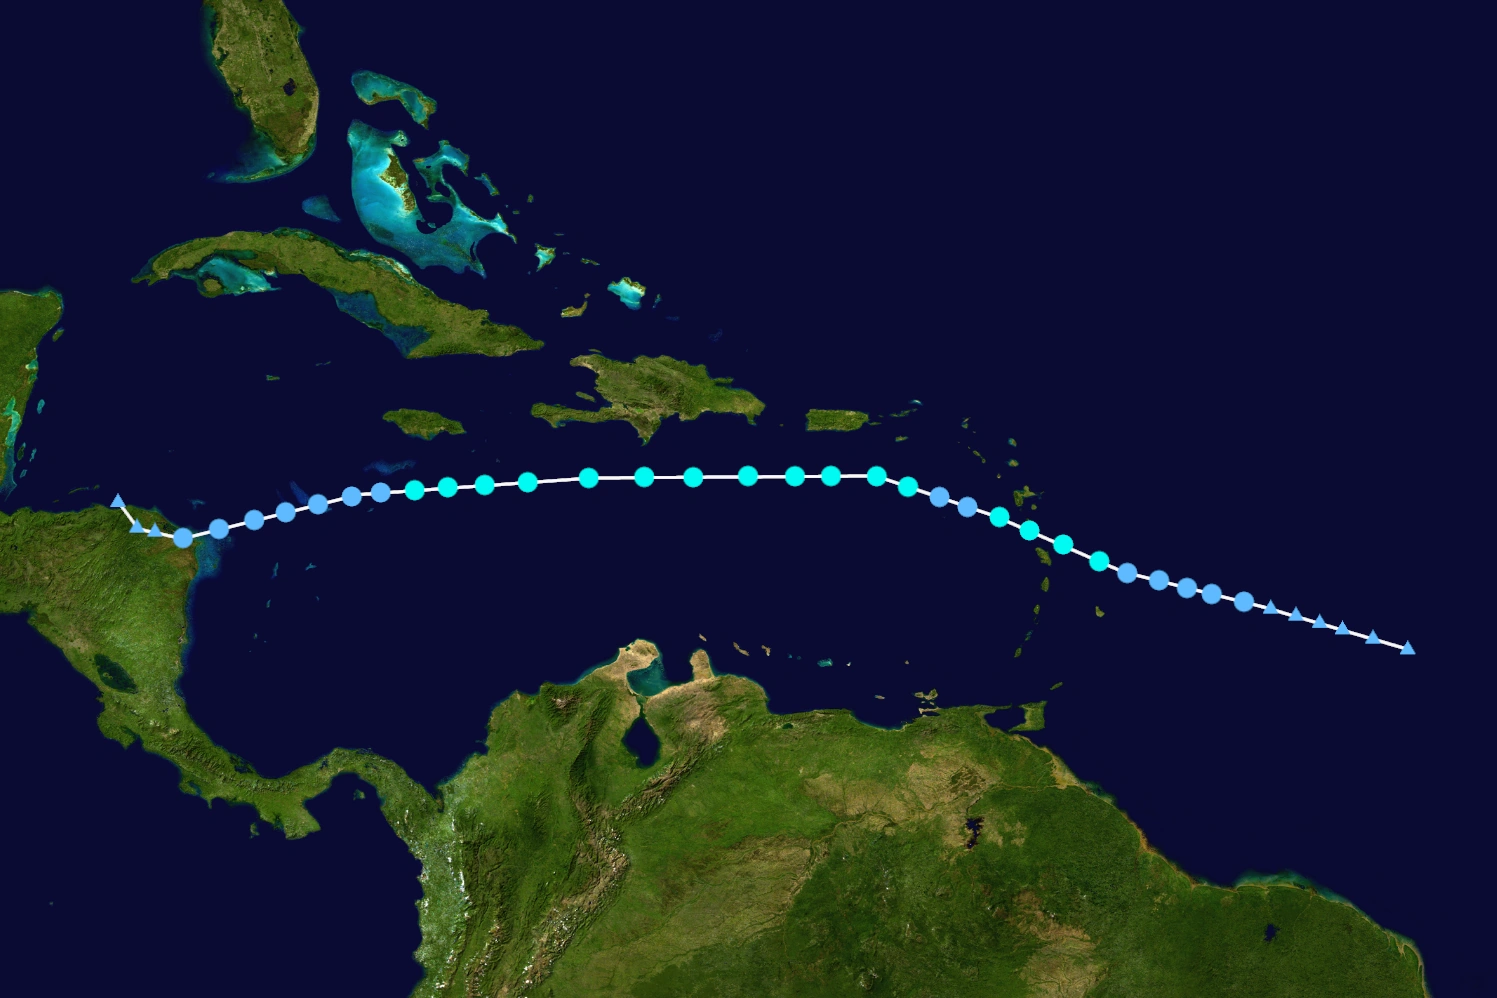
Hurricane Don[]
| Category 1 hurricane (NHC) | |
  | |
| Duration | July 15 – July 22 |
|---|---|
| Peak intensity | 85 mph (140 km/h) (1-min) 974 mbar (hPa) |
A tropical wave was first noted in the open Atlantic in July 6, going west with no change of organization. It then entered the Caribbean Sea on July 12, where it begin to organize. It showed signs of development despite not having a circulation. On July 14, the well-organized low began to develop a center of circulation, and it developed into Tropical Depression Five on the next day. Six hours later, it quickly acquired tropical storm characteristics, thus prompted the NHC to upgrade it to Tropical Storm Don. Don continued to intensify, and it quickly began to form an eye late on July 15. At 0000 UTC on July 16, Don briefly became a hurricane before weakening slightly due to dry air. The next day at 0600 UTC, Don outcomes the dry air and was upgraded to a hurricane again.
Hurricane Emily[]
| Category 4 hurricane (NHC) | |
  | |
| Duration | August 12 – August 21 |
|---|---|
| Peak intensity | 150 mph (240 km/h) (1-min) 928 mbar (hPa) |
A tropical wave was first noted near Africa in early-August, going towards the west at 10 mph (16 km/h). It very gradually organized while moving westward. The NHC soon monitored the system for a potential development for the next 7 days. On August 11, convention started to deepen and it had became well-organized, but it had not developed a circulation at that time. On August 12, an Air Force Reconnaissance flight reported a center of circulation inside the system, thus the NHC designated it as Tropical Depression Six at 1200 UTC, just south-southeast of the island of Barbados. The depression struck some islands of the Grenadines prior to its intensification to tropical storm status, and some minor damage was reported for the archipelago. On August 13 at 1800 UTC, it intensified into a tropical storm and earned the name Emily by the NHC.
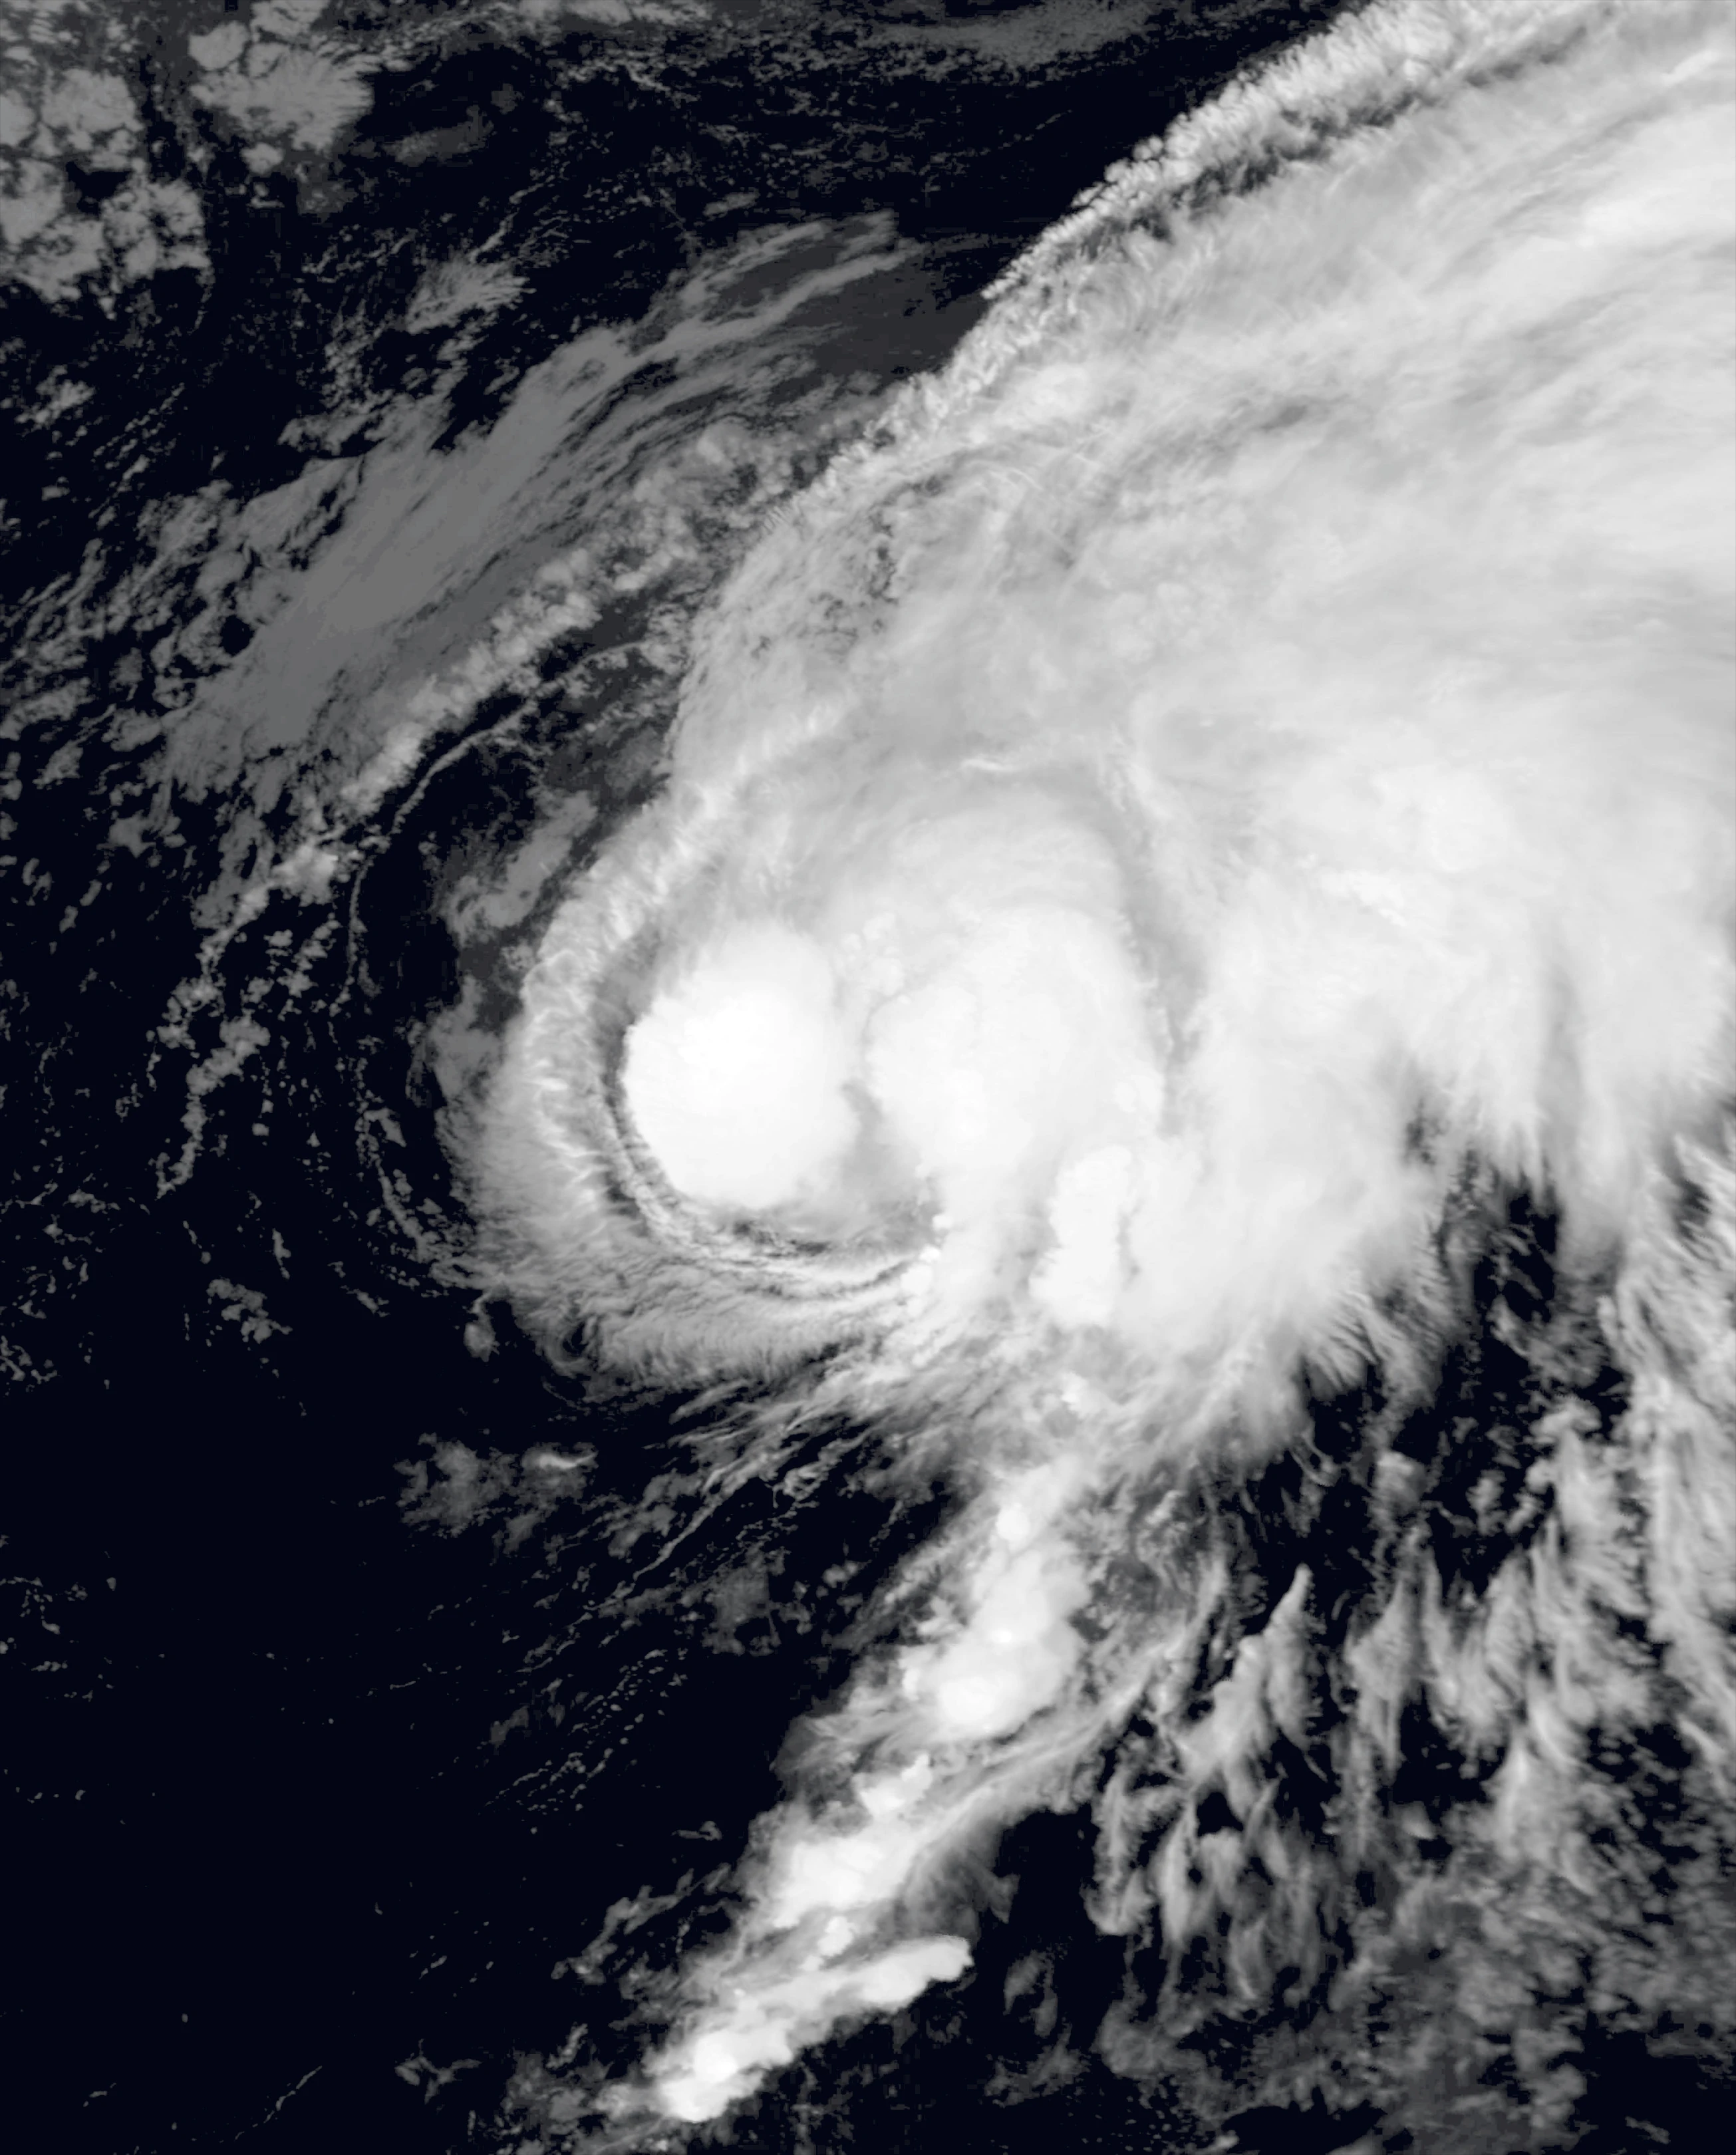
Tropical Storm Franklin[]
| Tropical storm (NHC) | |
  | |
| Duration | August 13 – August 18 |
|---|---|
| Peak intensity | 60 mph (95 km/h) (1-min) 998 mbar (hPa) |
On August 7, a tropical wave emerged off of Africa, drifting gradually northwestward with little change in organization for a couple of days. A day later, the NHC began monitoring the system as a potential to develop in the next 5 days or so. On August 11, it began to organize, its convection started to deepen a little. The next day, it was starting to develop a center of circulation, and it developed into a tropical depression on August 13 at 1800 UTC. The depression continued to gradually organize, and it intensified into Tropical Storm Franklin the next day. Franklin remained weak, initially peaking at 45 mph (70 km/h) and 1002 mbar before weakening due to moderate wind shear. It was downgraded to a tropical depression on August 15 at 1200 UTC. Early the next day, the wind shear decreased and that made way for the storm to intensify again, becoming a tropical storm again late on August 16. In the middle of the next day, it reached its peak intensity, with maximum sustained winds of 60 mph (95 km/h) and a minimum central pressure of 998 mbar (hPa). It rapidly abated due to cooler waters after its peak intensity, weakening to a tropical depression again on August 18 at 0000 UTC and then transitioned into a post-tropical cyclone 12 hours later.
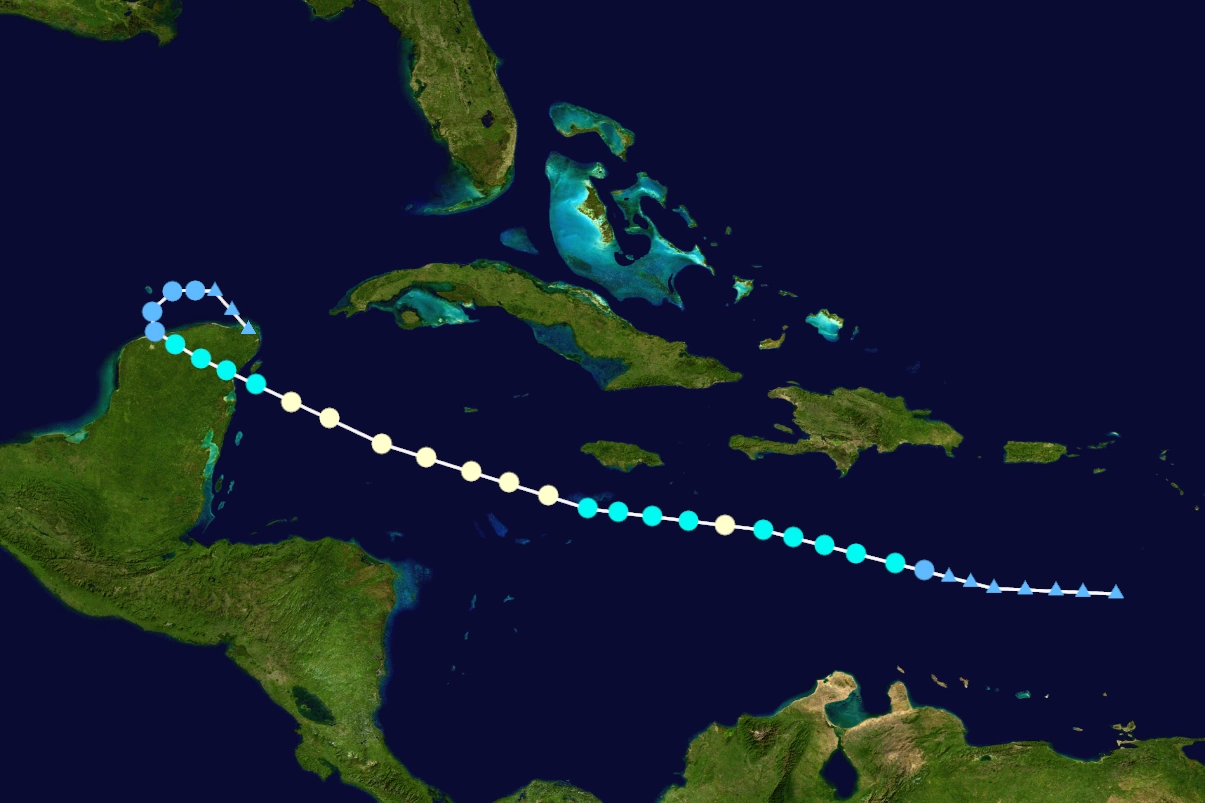
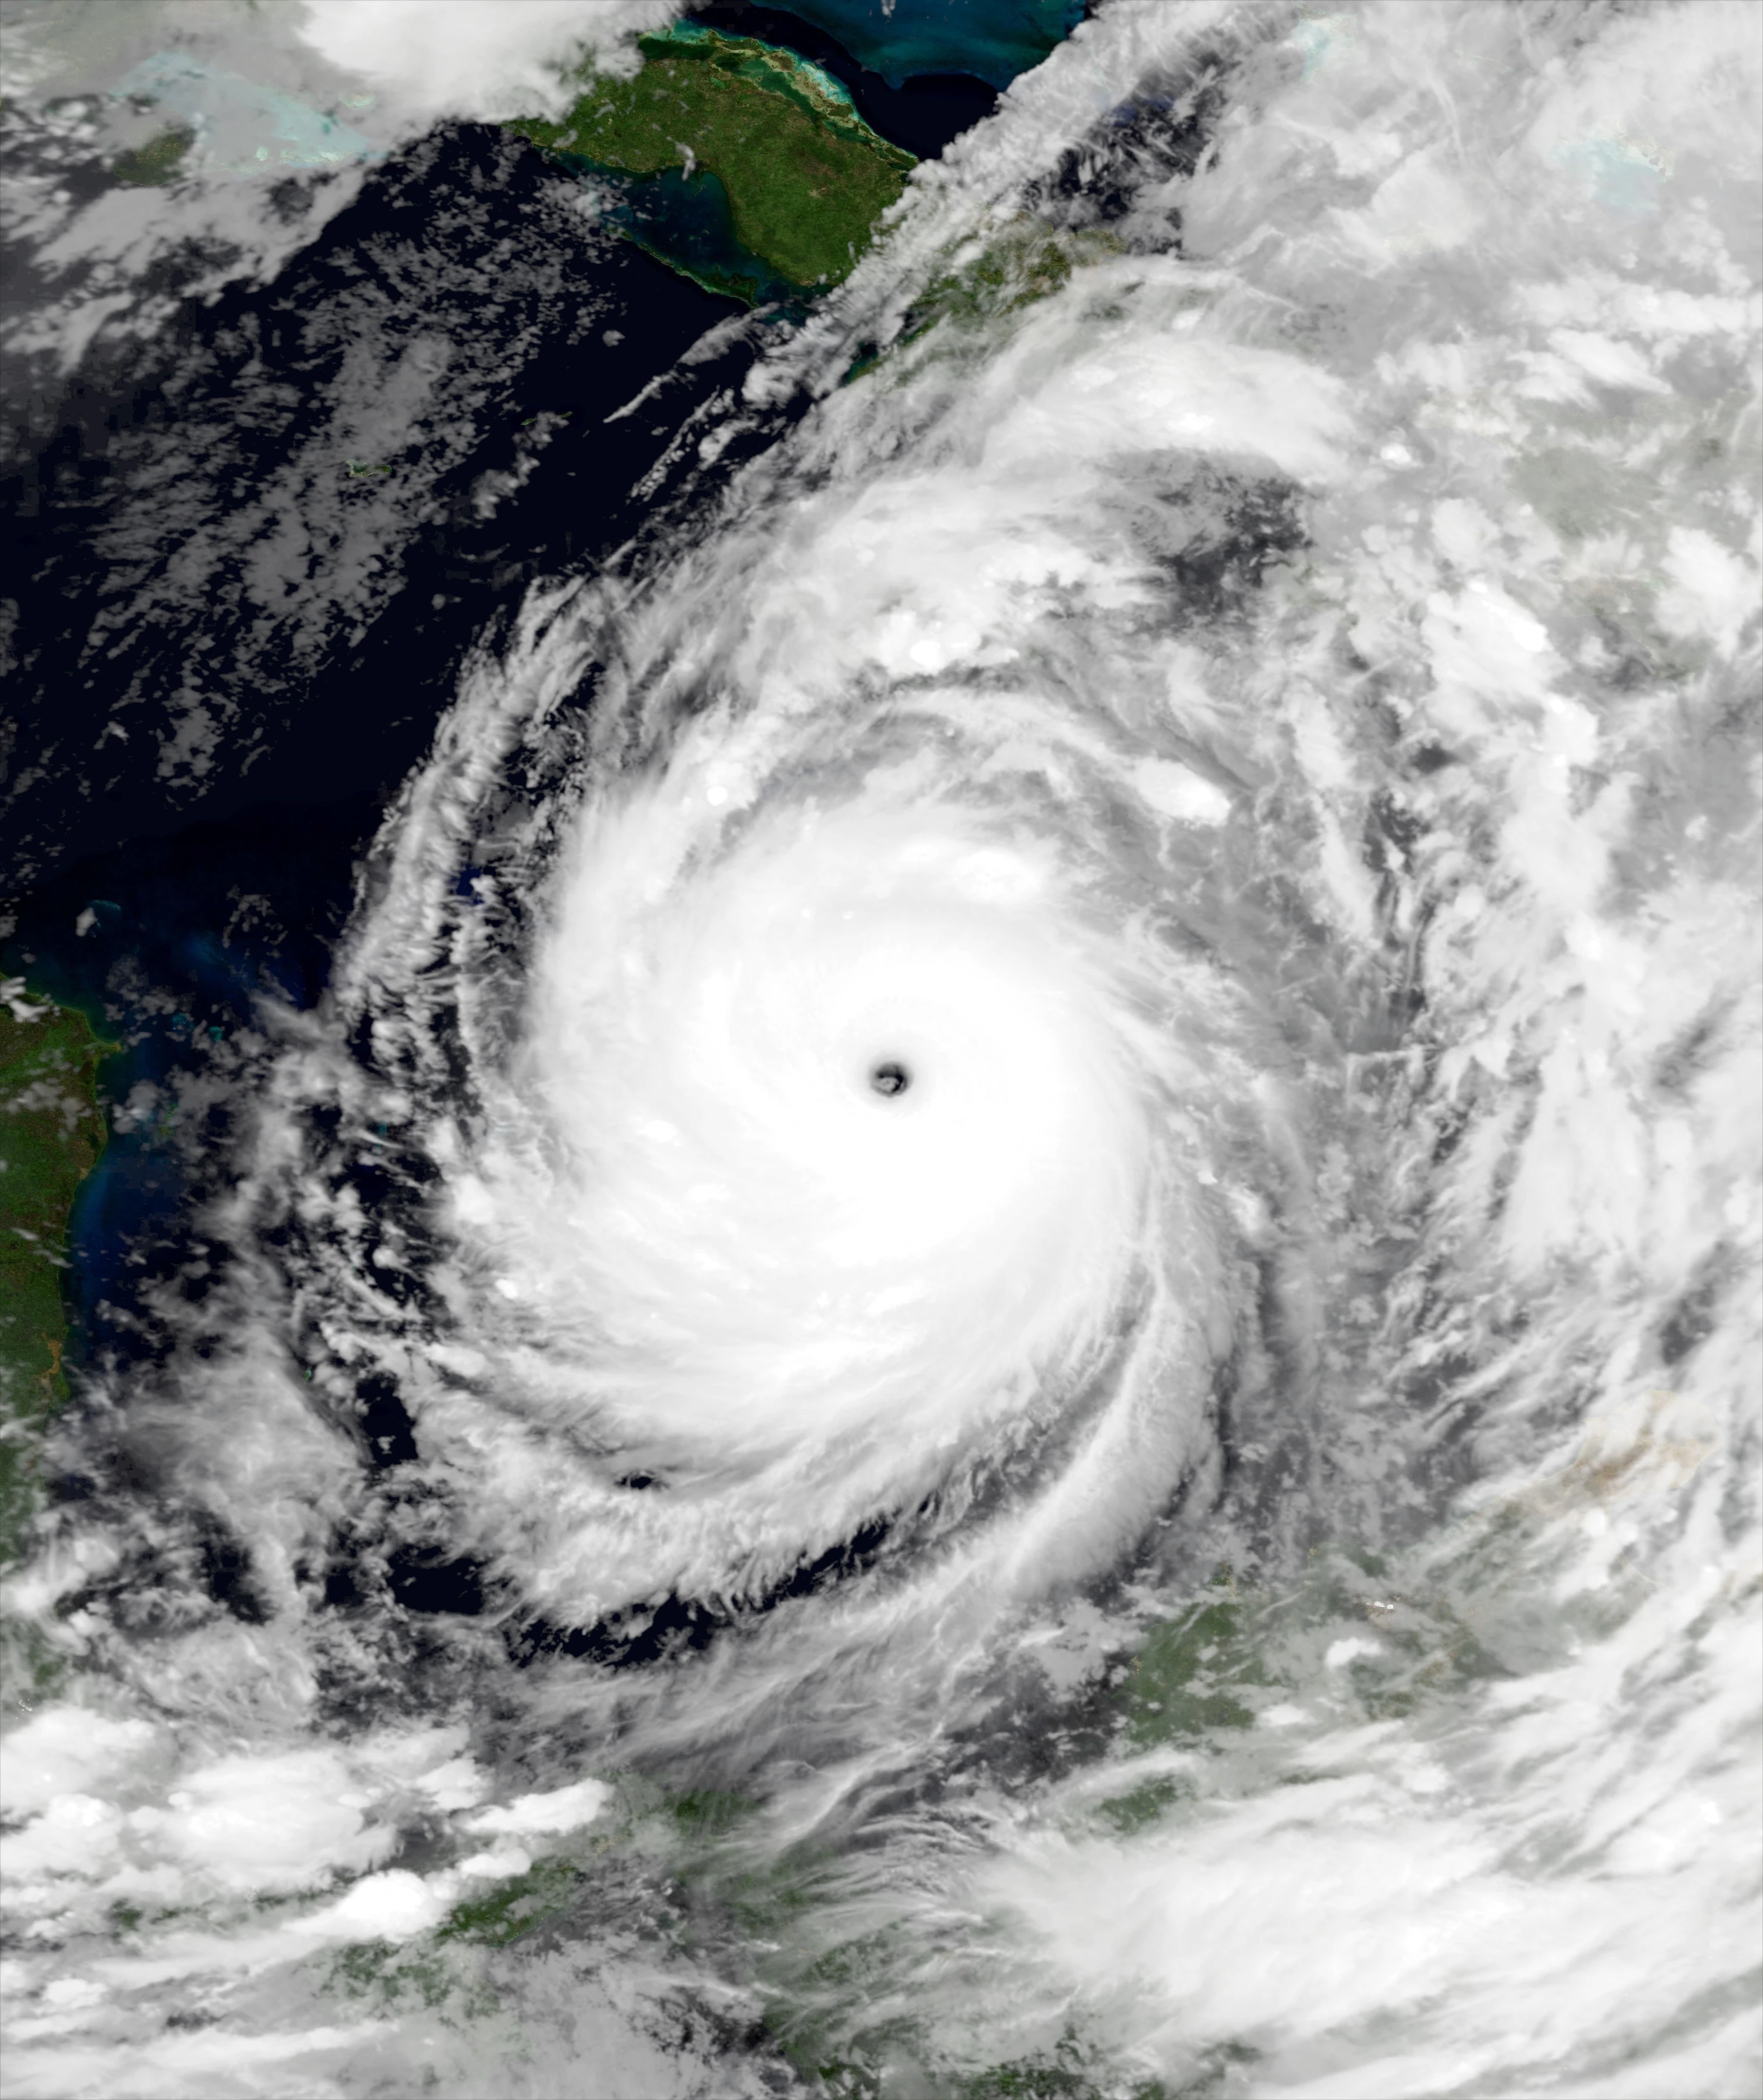
Hurricane Gert[]
| Category 5 hurricane (NHC) | |
 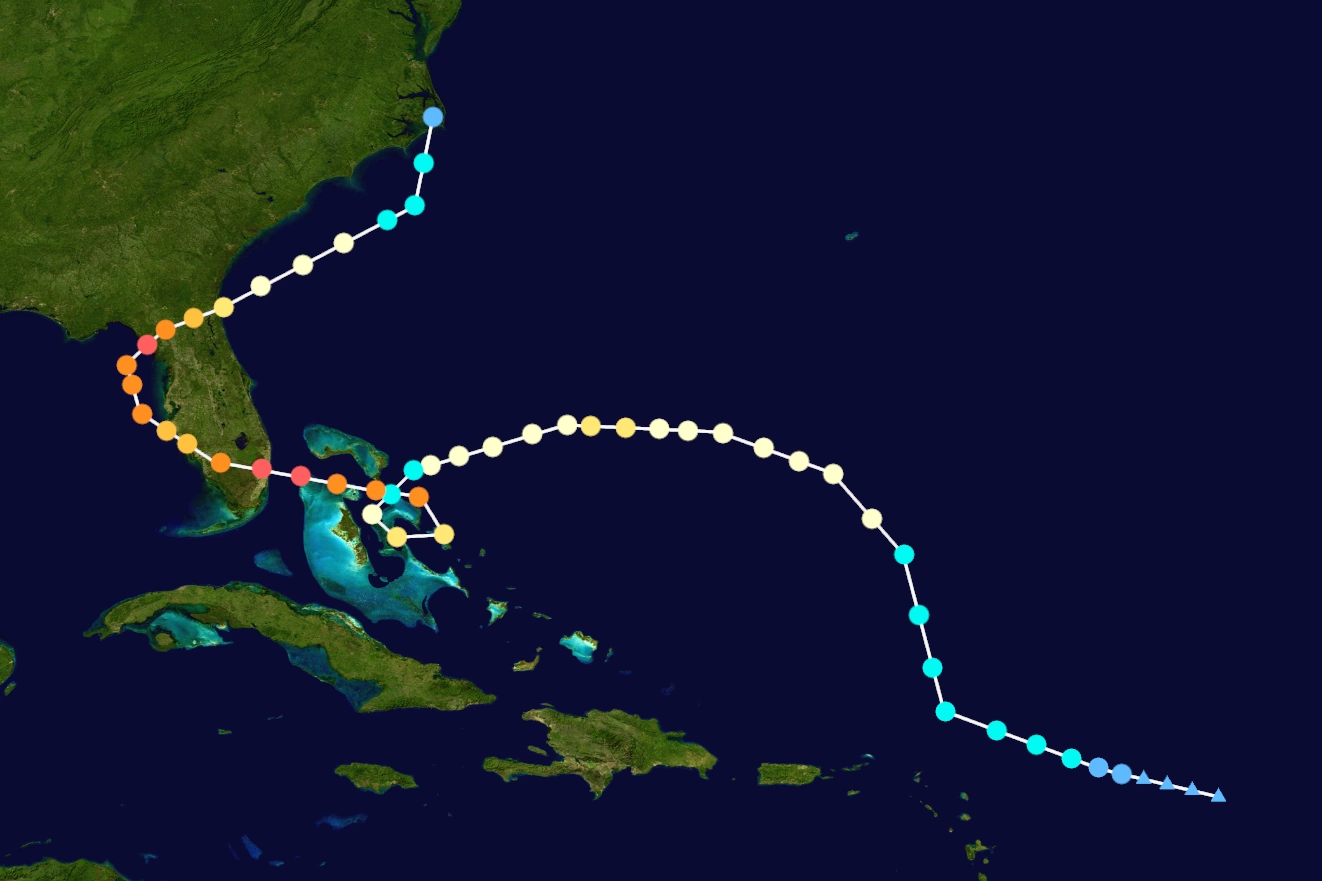 | |
| Duration | August 22 – September 3 |
|---|---|
| Peak intensity | 165 mph (270 km/h) (1-min) 917 mbar (hPa) |
- Main article: Hurricane Gert (Sandy156)
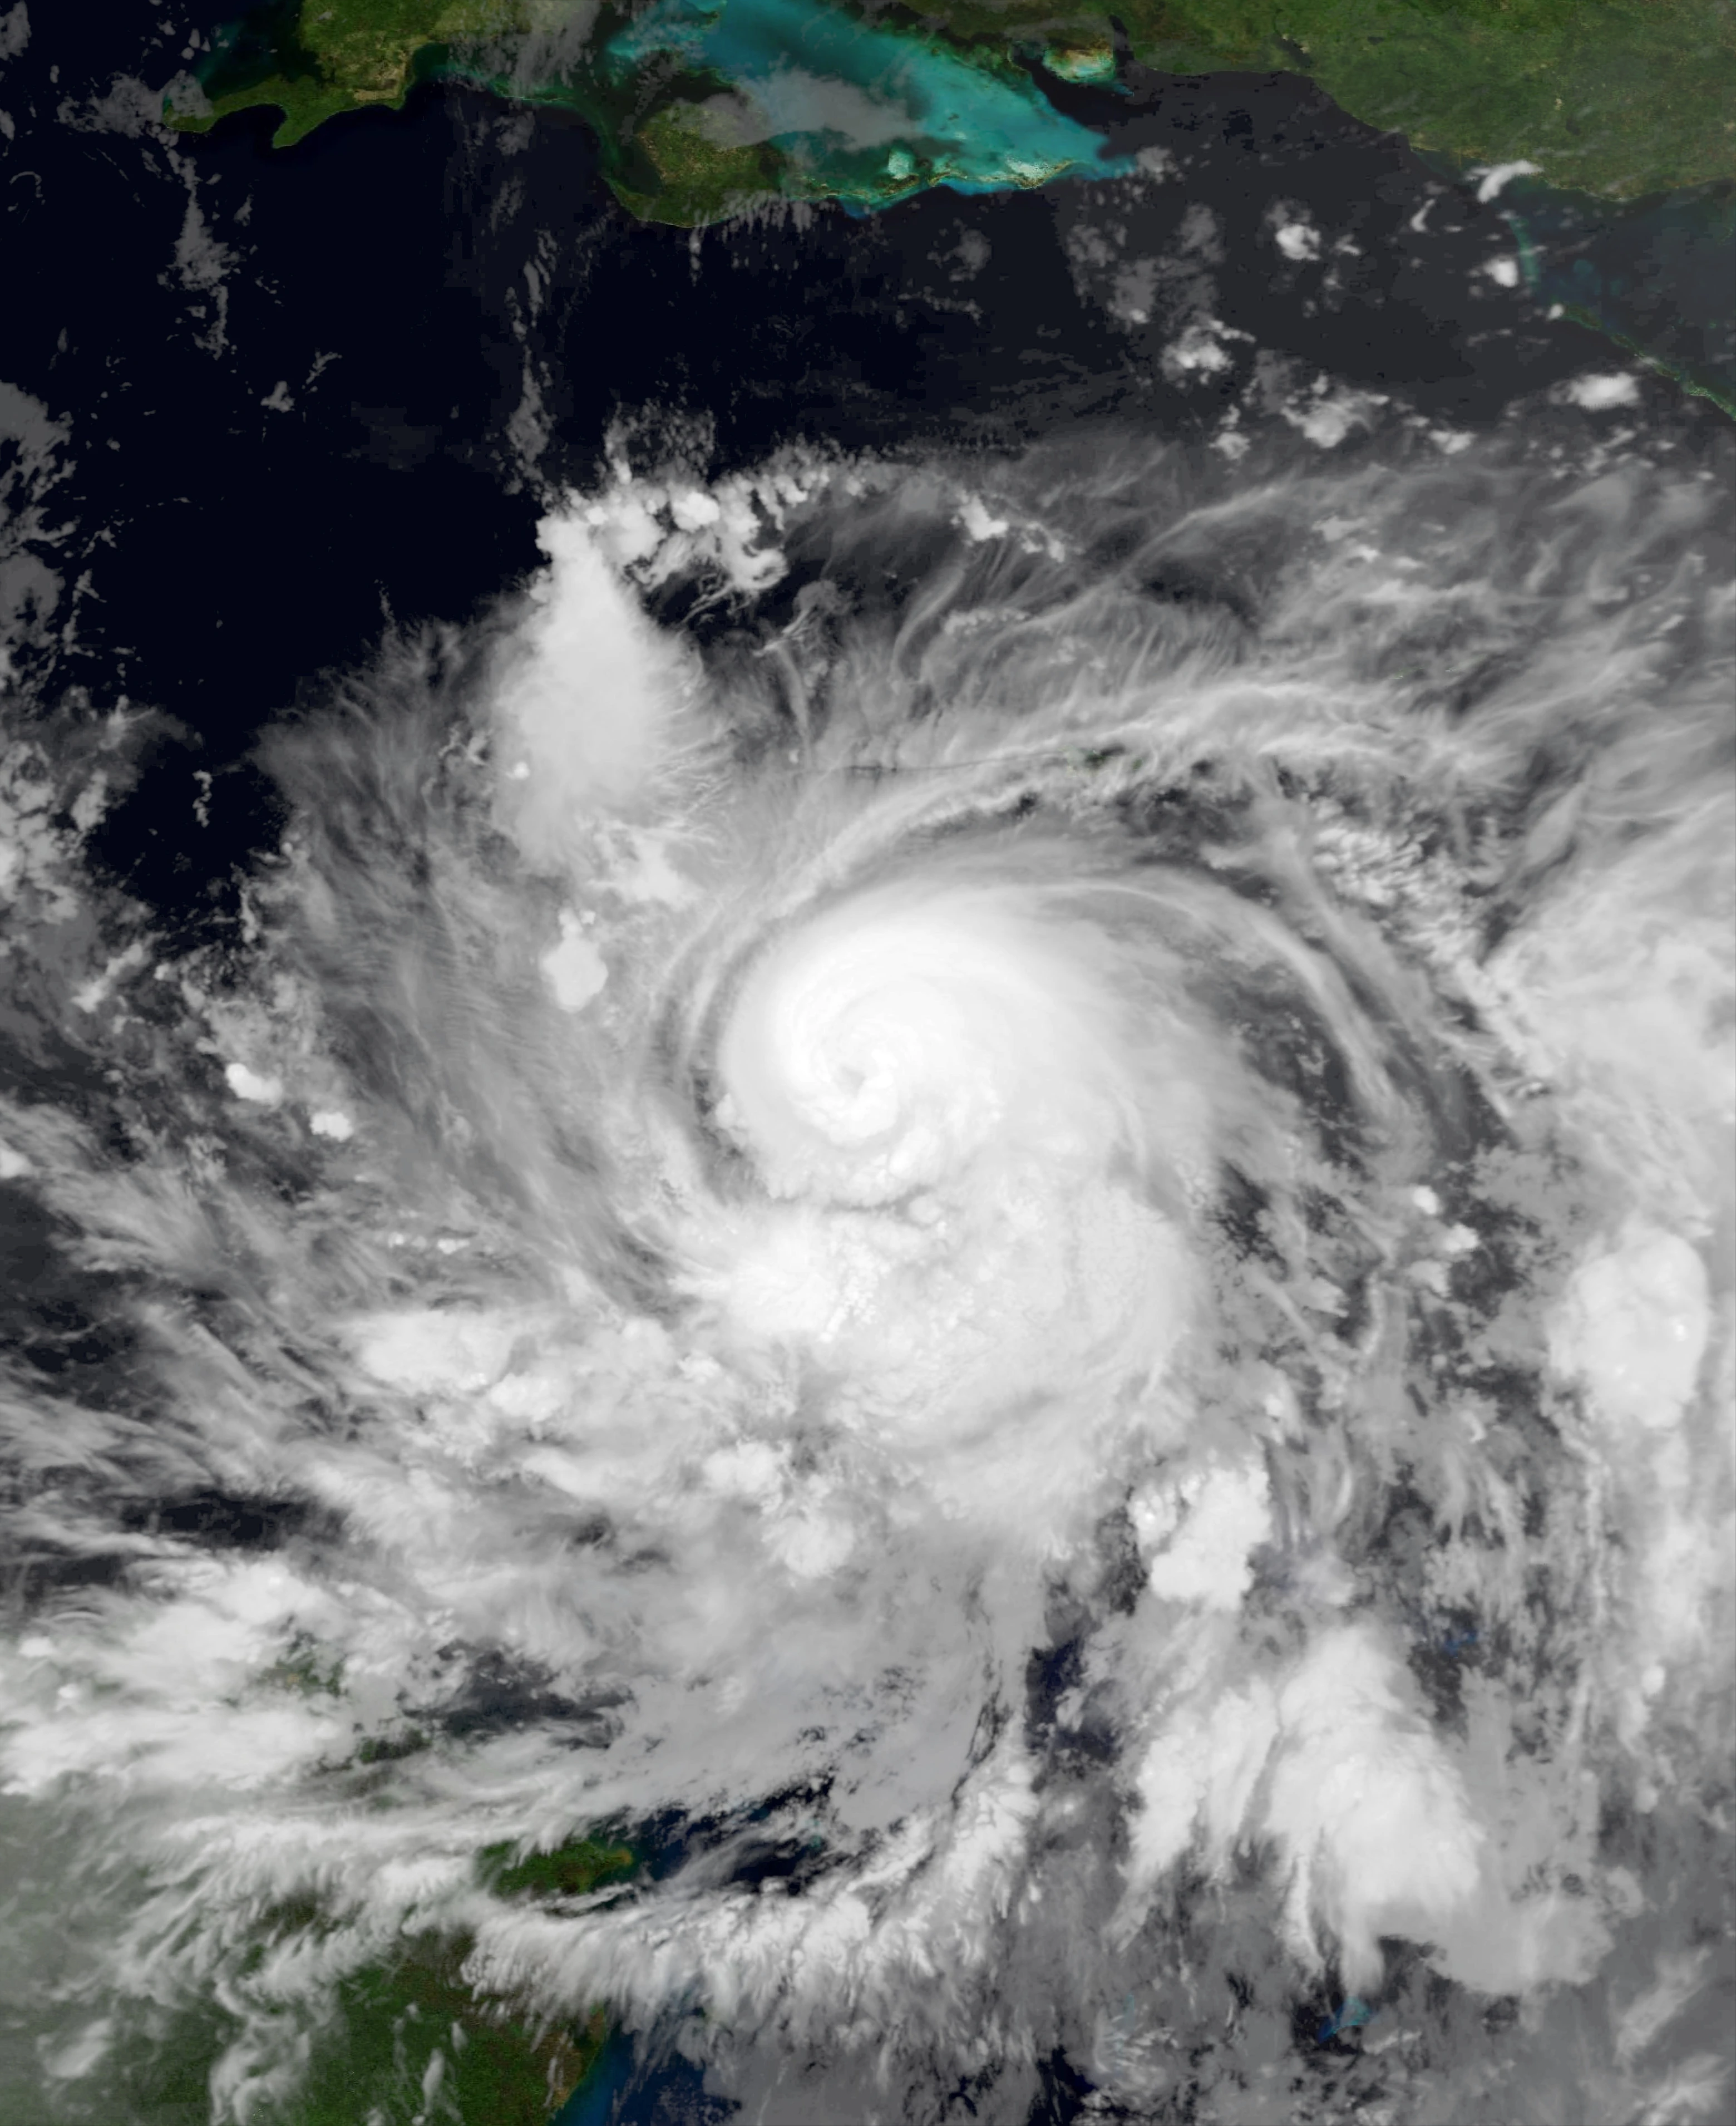
In mid-August, a tropical low was first noted in the open Atlantic Ocean. The NHC then indicated that development into a tropical cyclone was possible in the next 10 days. For the next few days, the tropical low gradually moved west-northwest with no change of organization due to the low interacting with dry air. On August 20, the low gradually organized and started to get a consolidated convection near the center of the low and had defined a center of circulation. On August 22, the well-organized storm led the development of Tropical Depression Eight. The depression influenced bursts of deep convection for the next 12 hours, which further prompted NHC to upgrade it to a tropical storm, and earning the name Gert. The storm steadily strengthened over warm waters up to 80F (27 C) degrees and low wind shear of 10 knots. It then took a turn to the north-northwest the middle of the next day while still intensifying. A few hours later, it was starting to develop an eye feature. On August 24 at 1200 UTC, it was upgraded to a hurricane. Earlier the next day, it abruptly ran into increasing wind shear up to 25 kn from the west, which slowed down the intensification for the hurricane. Despite the wind shear, it intensified into a Category 2 hurricane on August 25 at 0600 UTC with maximum sustained winds of 110 mph (160 km/h) and a minimum central pressure of 978 mbar (hPa) at its initial peak intensity before encountering stronger wind shear that weakened the storm to a Category 1 hurricane twelve hours later. It took another turn to the west-southwest and then futher weakened to a tropical storm early on August 27. A sudden change of increasing water temperatures plus wind shear lowering while the storm is over the Bahamas, made way for the storm to rapidly intensify. It strengthened back into a hurricane later that day and then went from a minimal hurricane to a Category 4 hurricane in roughly 18 hours, while making some kind of a cyclone loop at that time. Then on August 29 at 0000 UTC, it strengthened into a Category 5 hurricane, the first one since Hurricane Kyle 3 years prior. It then reached its peak intensity a few hours later, with maximum sustained wind speeds of 160 mph (260 km/h) and a minimum central pressure of 920 mbar (hPa) before striking the county of Broward in Florida. Gert rapidly weakened during its landfall, going to a Category 3 hurricane just 12 hours after landfall. It emerged from Florida into the Gulf of Mexico on August 30, where it continued its intensification there. It strengthened into a Category 4 hurricane at 0600 UTC that day, and then back to a Category 5 hurricane early the next day, before striking Florida a second time, near Shired Island. It rapidly weakening over land again, diminishing below major hurricane strength when it emerged from Florida again at 1800 UTC that day. It became way less organized than before, and was weakening due to high wind shear ahead of the storm. Its structure started to collapse when it weakened to a tropical storm on September 2 at 1800 UTC. It turned to the north-northwest to make one last landfall in North Carolina and as tropical depression on September 3 before dissipating shortly after landfall.
Hurricane Harold[]
| Category 4 hurricane (NHC) | |
  | |
| Duration | September 2 – September 16 |
|---|---|
| Peak intensity | 145 mph (230 km/h) (1-min) 931 mbar (hPa) |
A tropical wave emerged from Africa in late-August, moving westward at around 19 mph (30 km/h) with little change of organization for a couple of days. On August 27, the NHC first monitored the tropical wave as a potential for development in the next 7 days. The next day, the disturbance started to gradually organize under low to moderate wind shear and warm waters, deeper bursts of convection were visible a few days later. On September 2, the mostly organized disturbance developed a circulation, which prompted the NHC to upgrade it to a tropical depression. Shortly after its formation, the system encountered an increase of wind shear, slowing down its intensification but still very gradually strengthening. On September 4 at 1200 UTC, the system was upgraded to a tropical storm briefly, earning the name Harold, before weakening back to a tropical depression. The next day, the wind shear values quickly decreased, making way for this system to strengthen to a tropical storm again at 1800 UTC. It then quickly developed an eye-like feature while still a tropical storm on September 6, and it intensified into a hurricane at 1800 UTC that day.
Tropical Storm Idalia[]
| Tropical storm (NHC) | |
  | |
| Duration | September 9 – September 17 |
|---|---|
| Peak intensity | 70 mph (110 km/h) (1-min) 993 mbar (hPa) |
Tropical Storm Jose[]
| Tropical storm (NHC) | |
 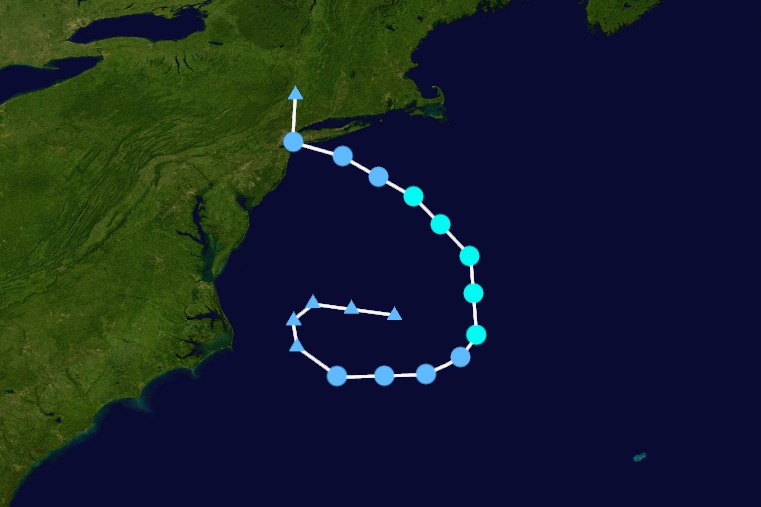 | |
| Duration | September 18 – September 21 |
|---|---|
| Peak intensity | 50 mph (85 km/h) (1-min) 1002 mbar (hPa) |
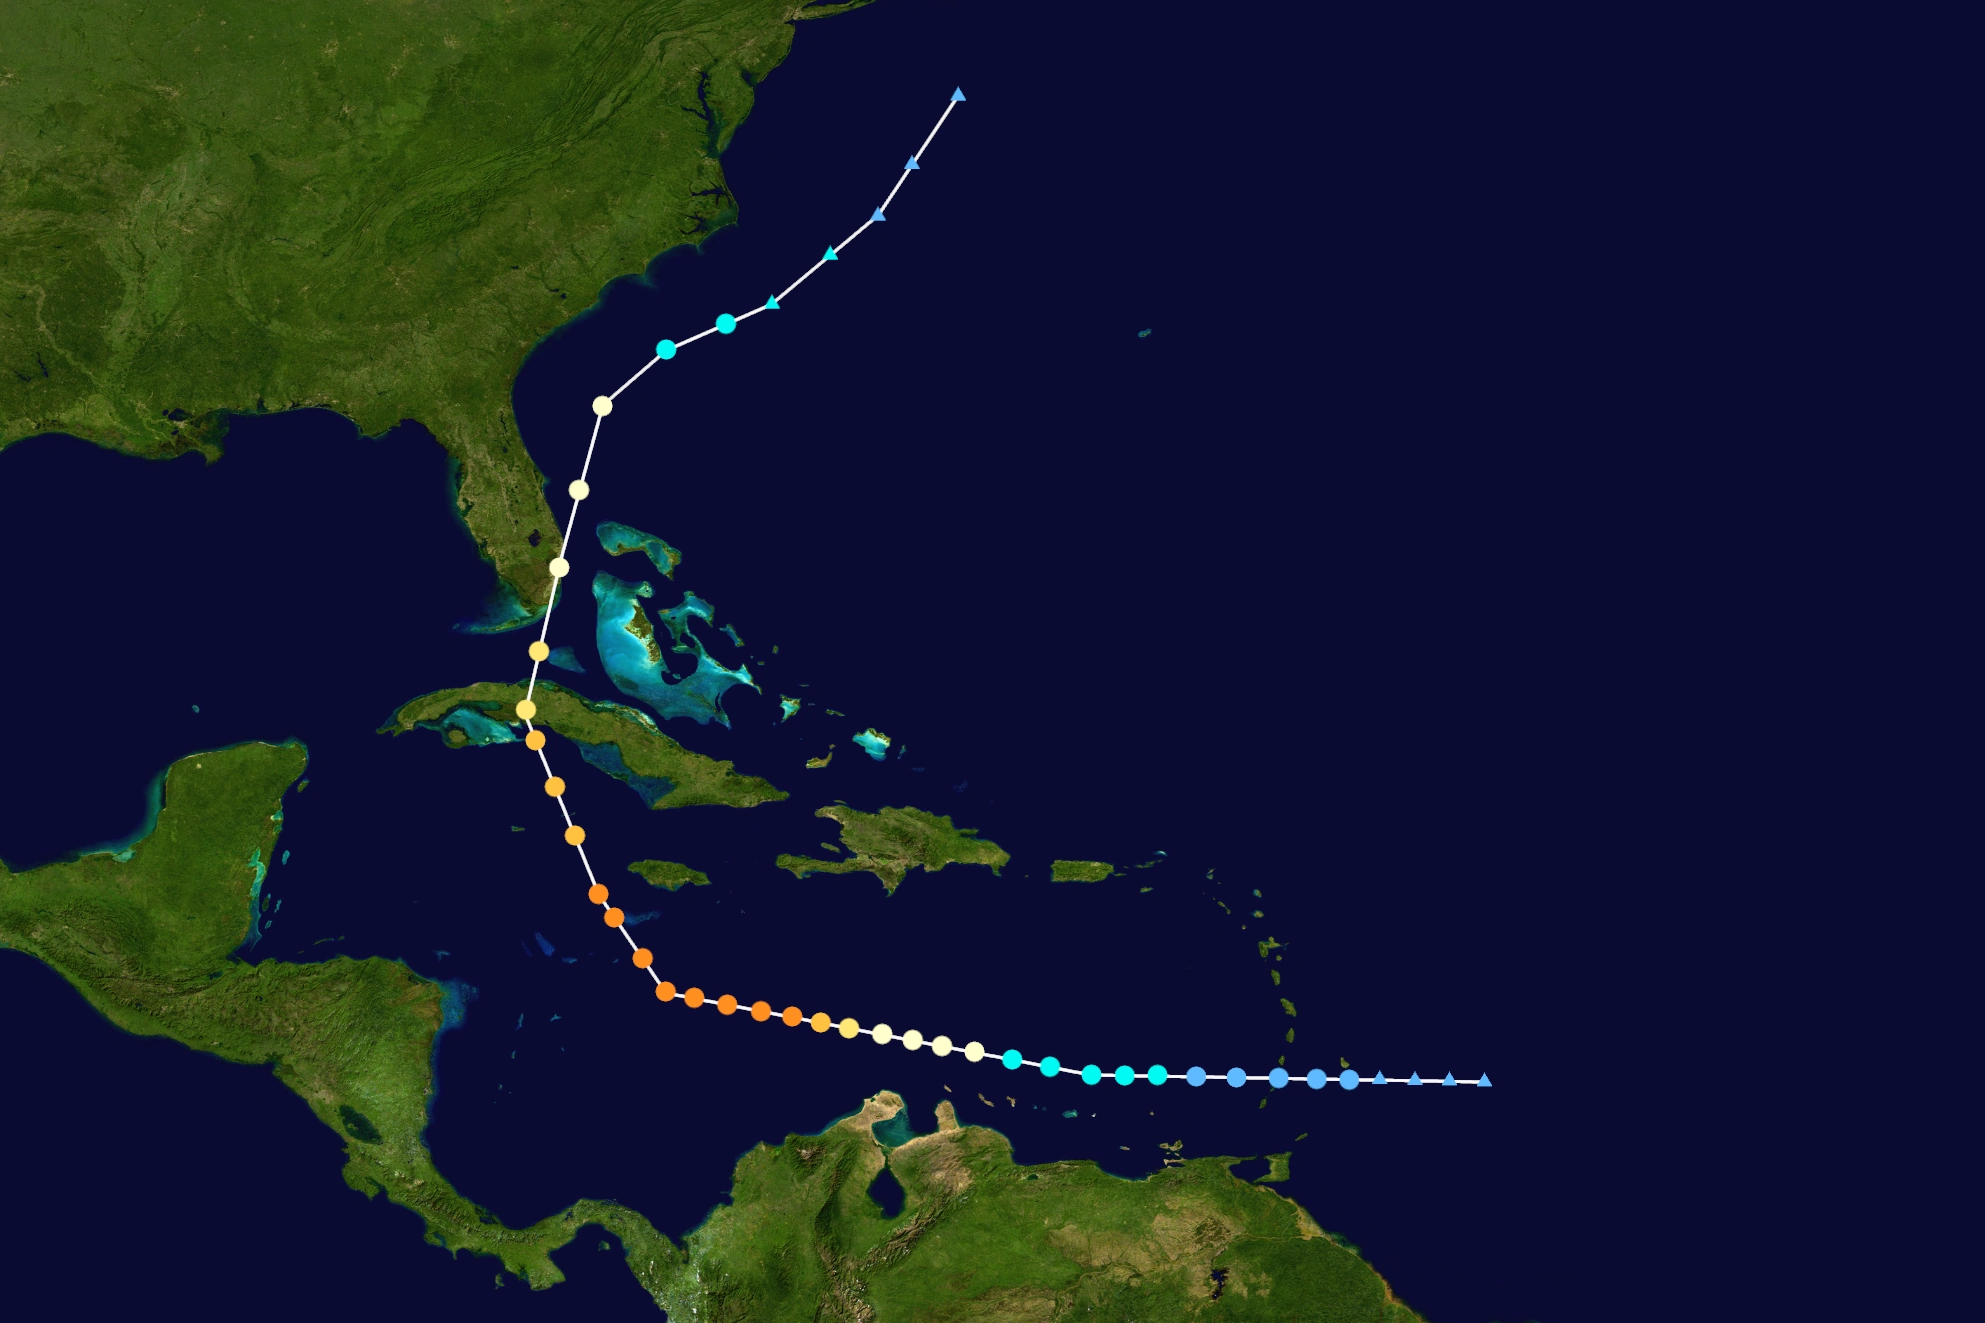
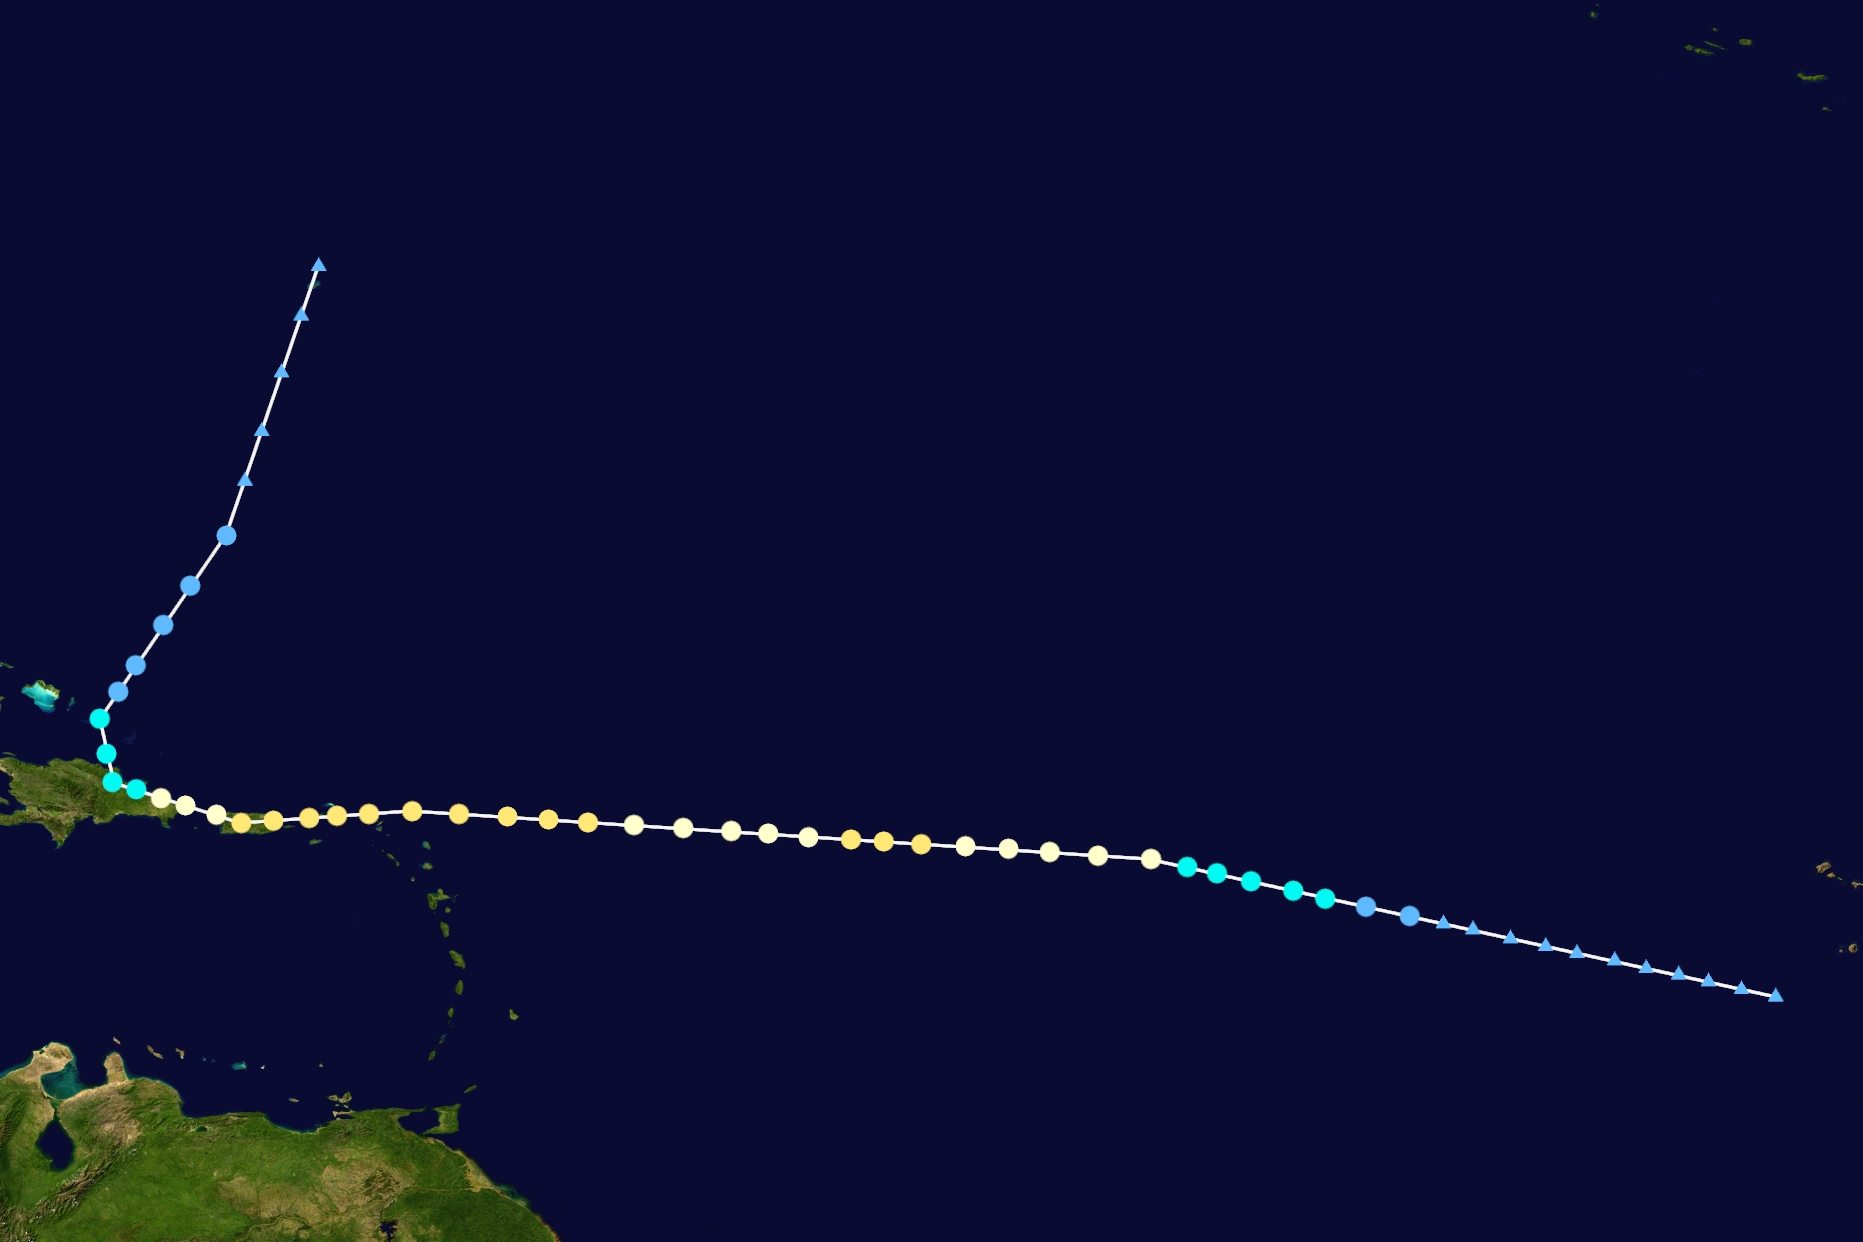
Hurricane Katia[]
| Category 5 hurricane (NHC) | |
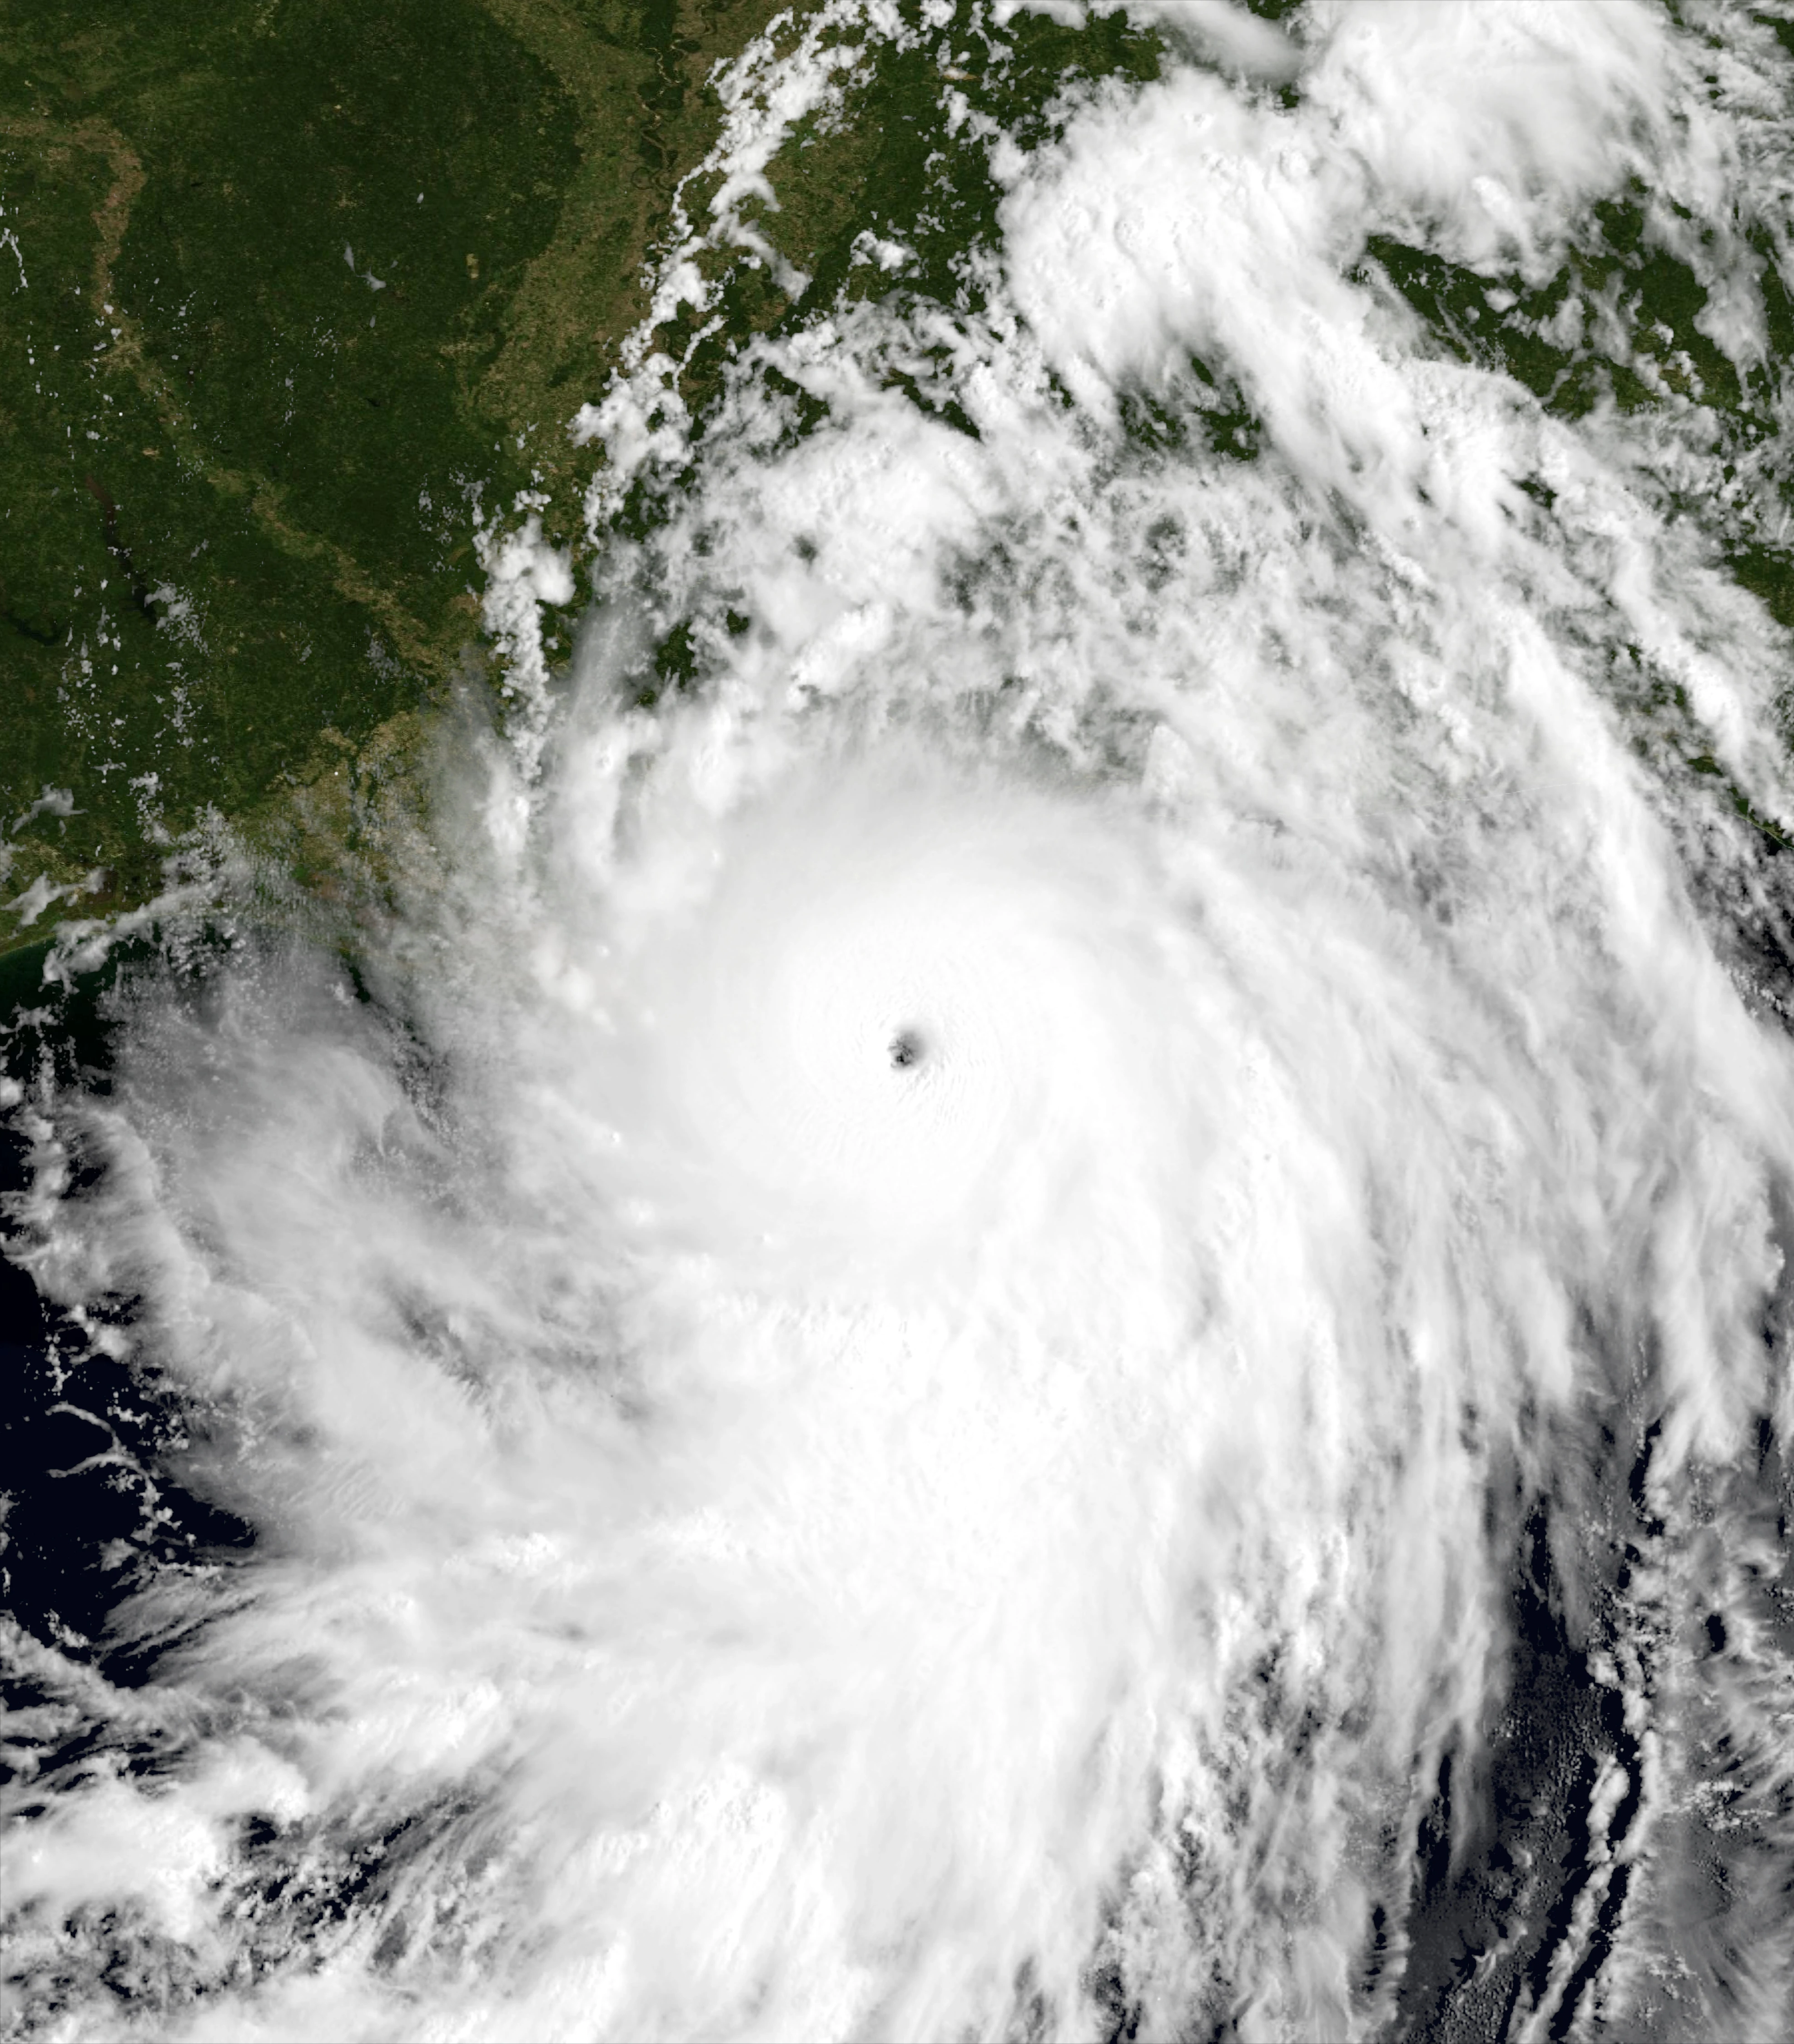 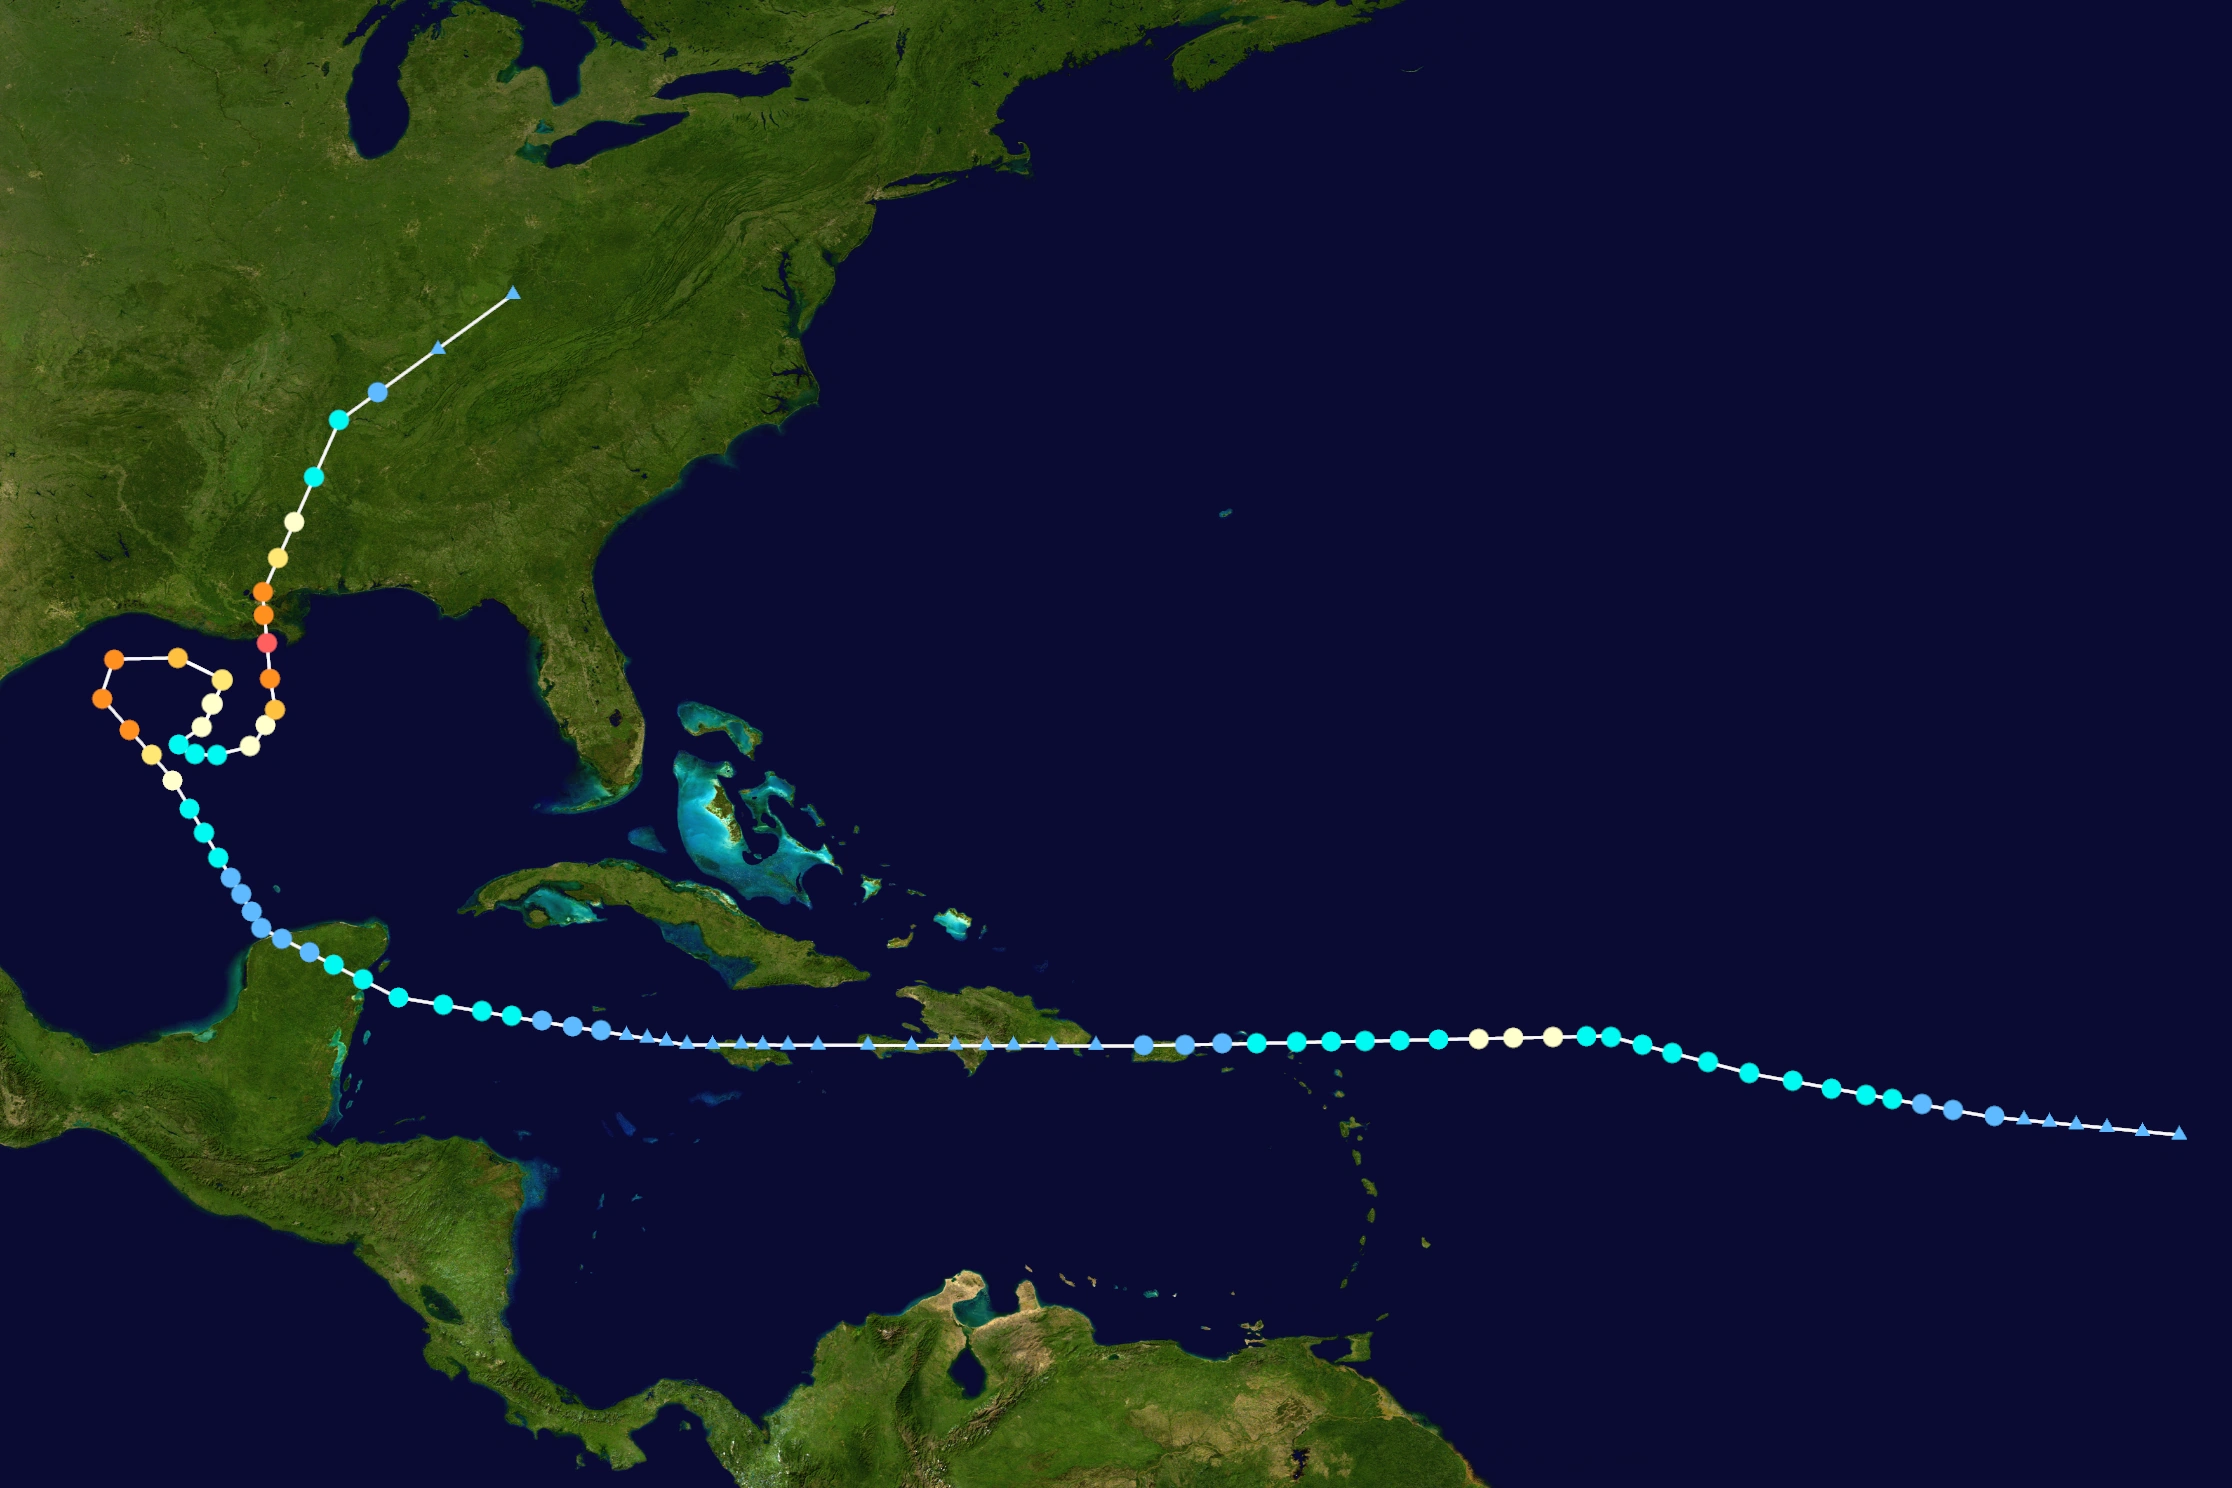 | |
| Duration | September 26 – October 17 |
|---|---|
| Peak intensity | 165 mph (270 km/h) (1-min) 913 mbar (hPa) |
- Main article: Hurricane Katia (Sandy156)
Hurricane Lee[]
| Category 1 hurricane (NHC) | |
  | |
| Duration | October 5 – October 14 |
|---|---|
| Peak intensity | 85 mph (140 km/h) (1-min) 979 mbar (hPa) |
Tropical Storm Margot[]
| Tropical storm (NHC) | |
 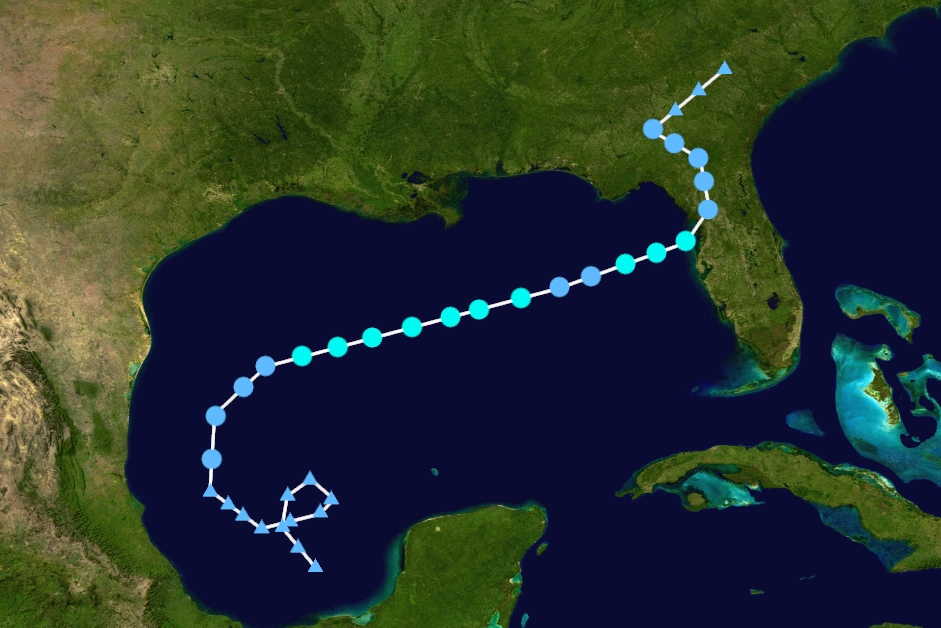 | |
| Duration | October 15 – October 21 |
|---|---|
| Peak intensity | 65 mph (100 km/h) (1-min) 997 mbar (hPa) |
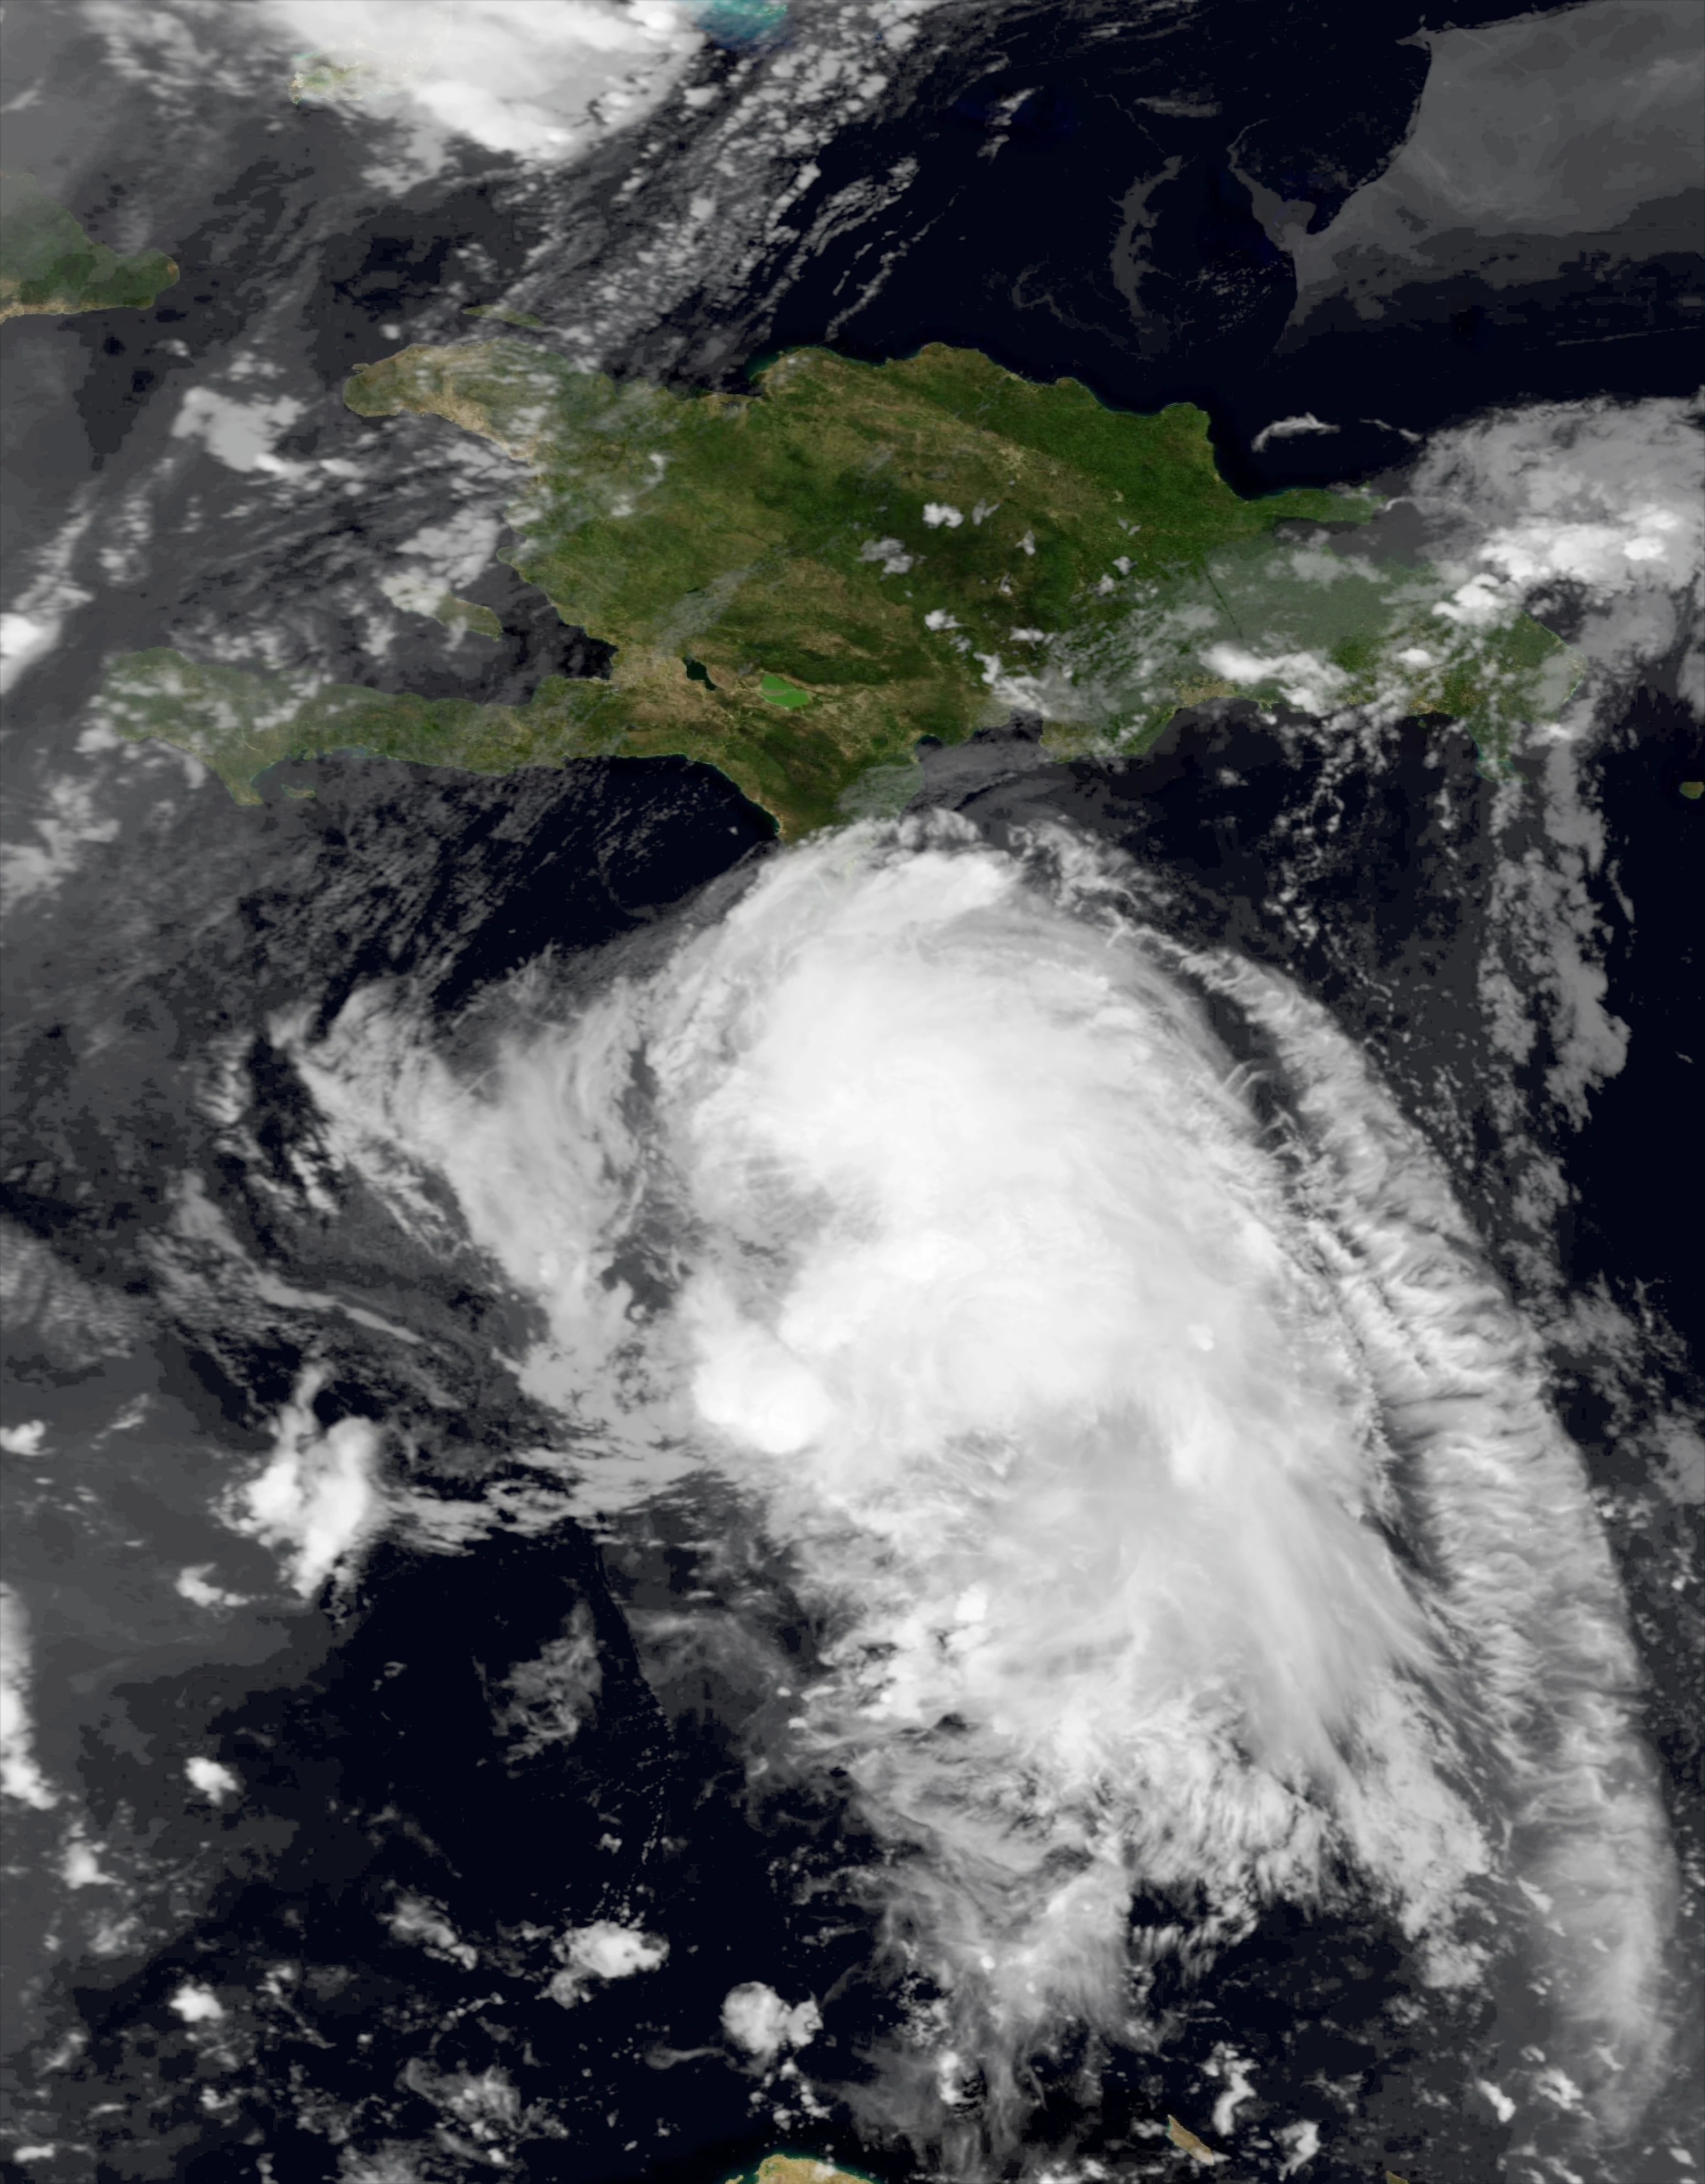
Hurricane Nigel[]
| Category 2 hurricane (NHC) | |
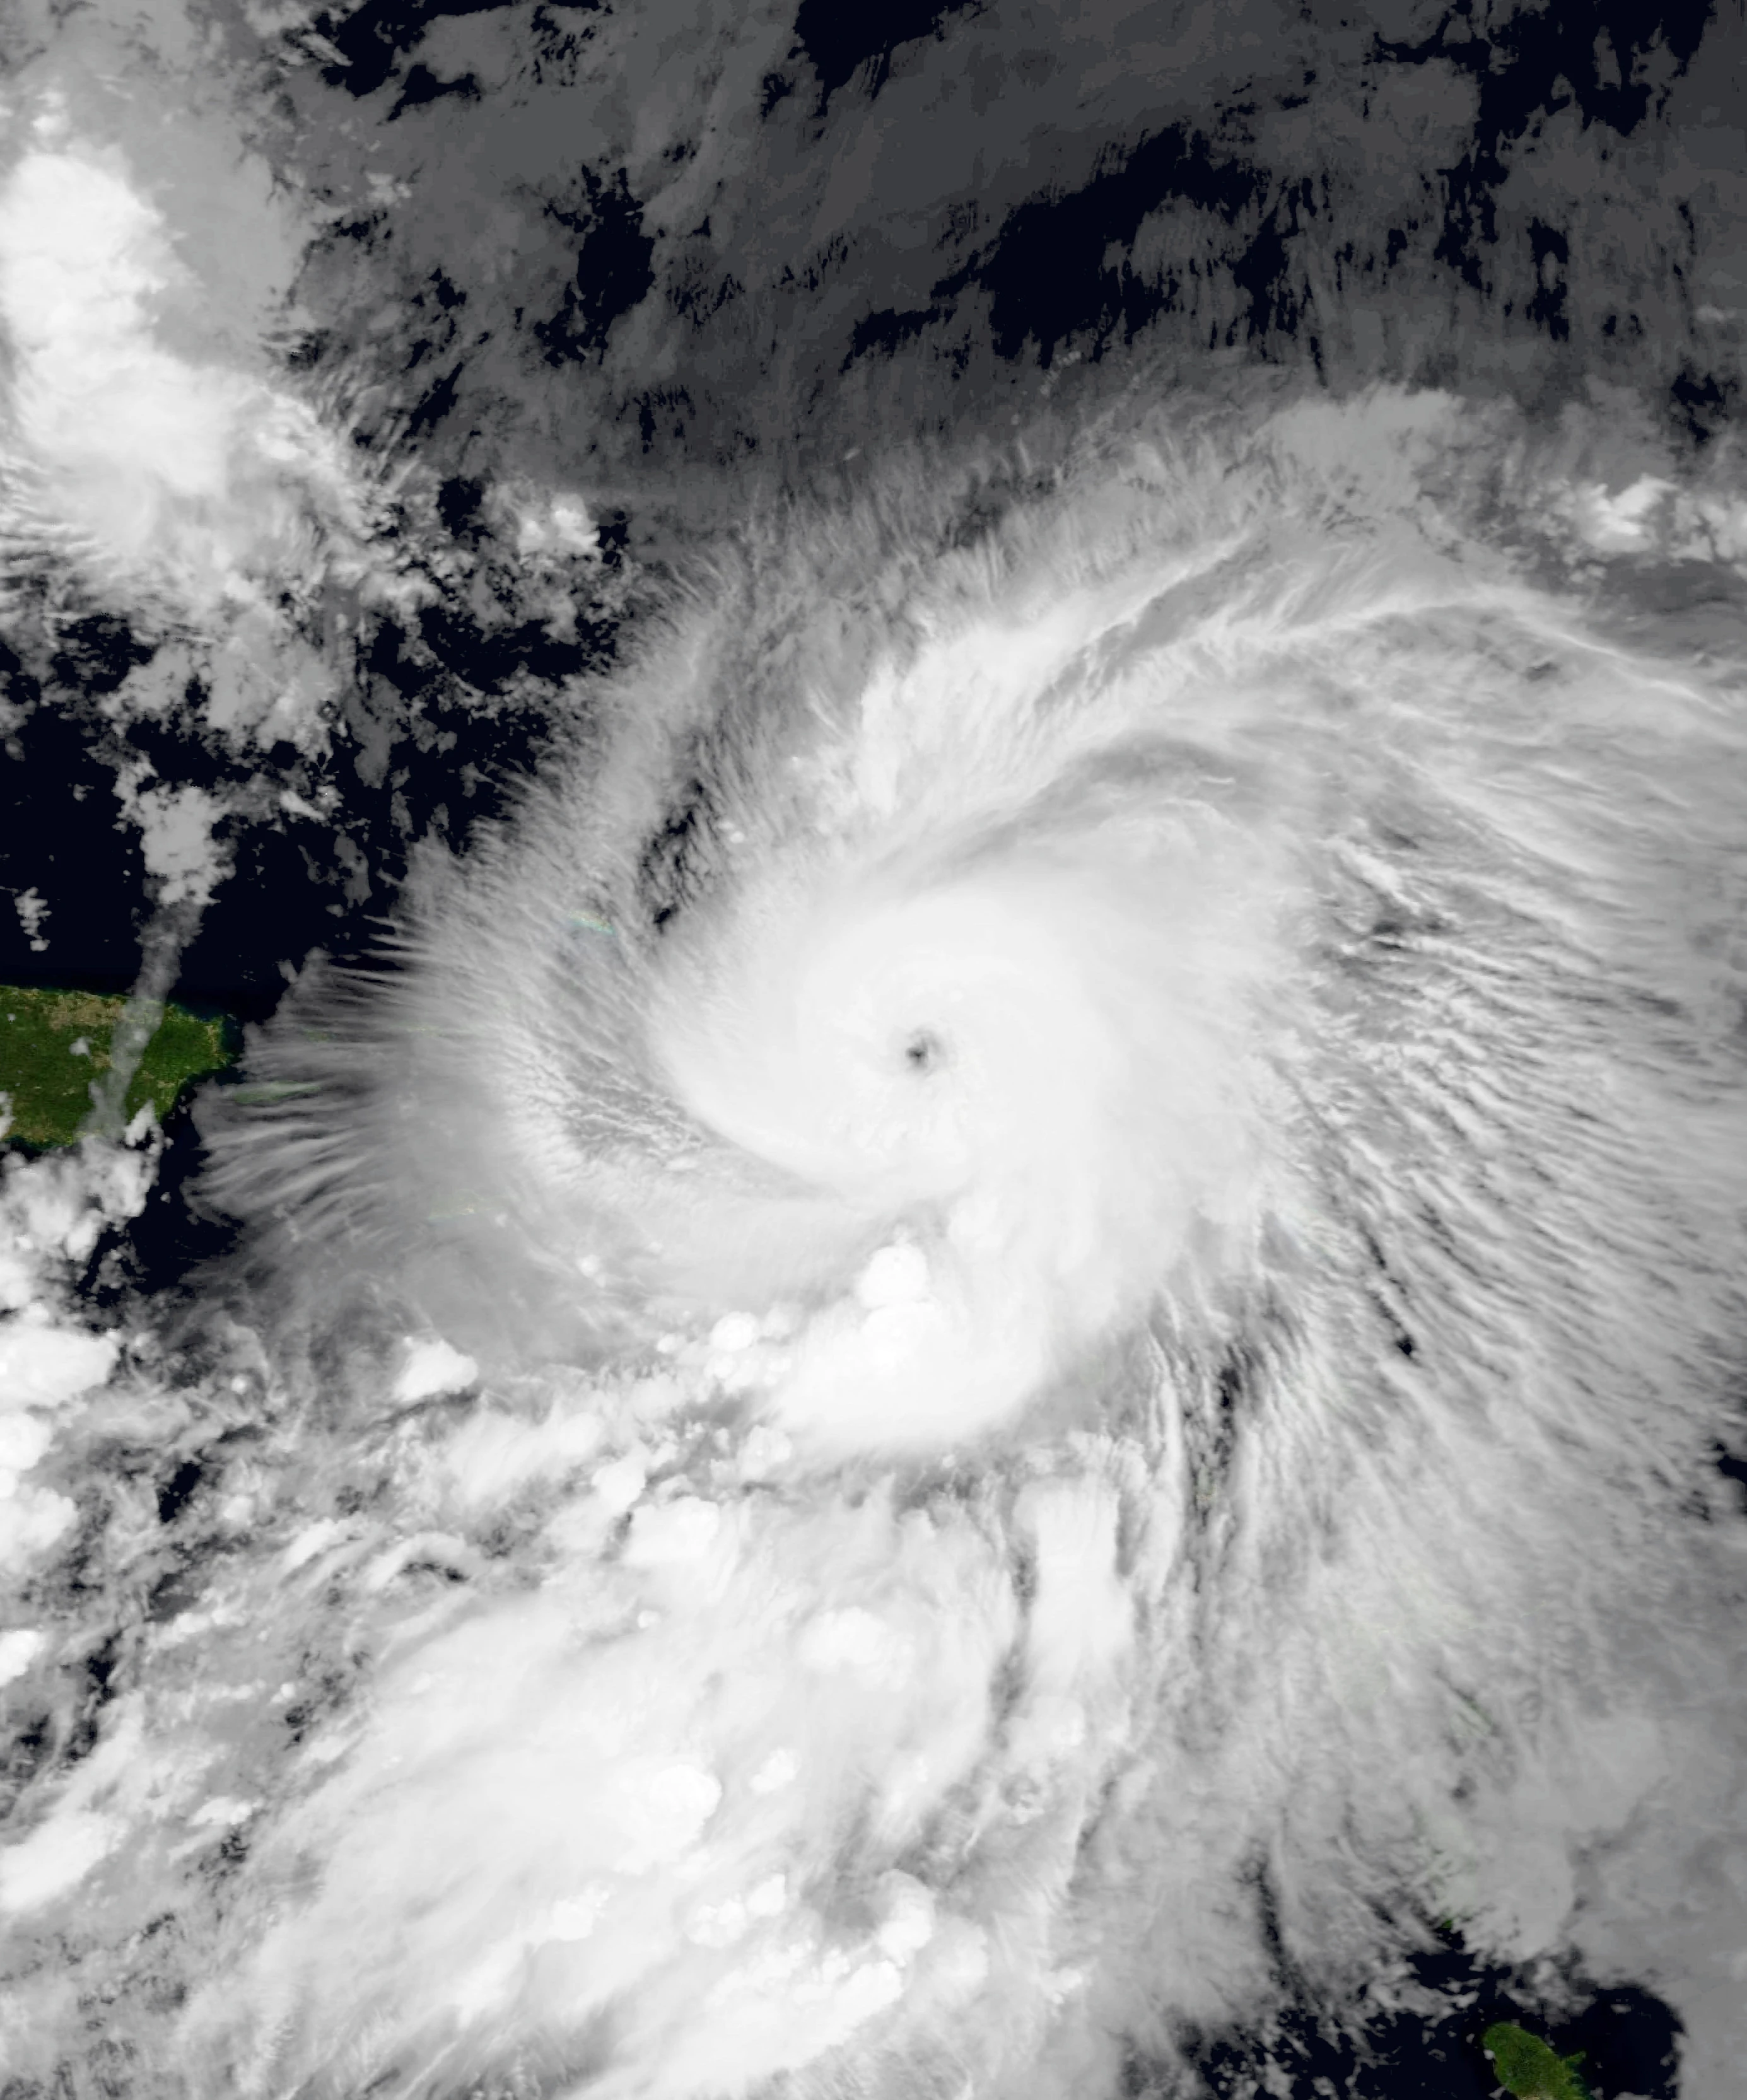  | |
| Duration | October 27 – November 6 |
|---|---|
| Peak intensity | 105 mph (165 km/h) (1-min) 970 mbar (hPa) |
- Main article: Hurricane Nigel
Tropical Storm Ophelia[]
| Tropical storm (NHC) | |
 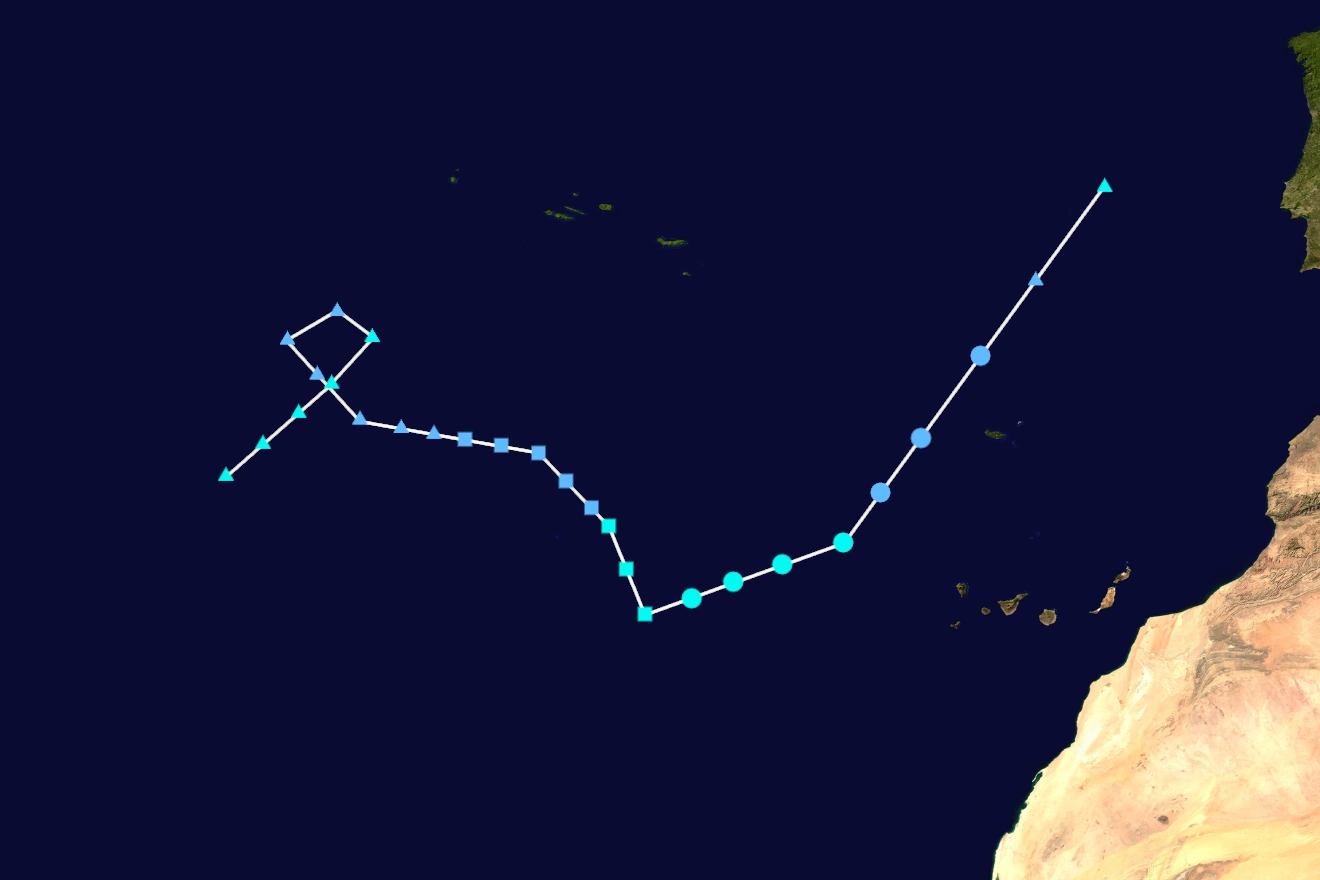 | |
| Duration | November 20 – November 24 |
|---|---|
| Peak intensity | 50 mph (85 km/h) (1-min) 1001 mbar (hPa) |
Storm names[]
The following list of names was used for named storms that formed in the North Atlantic in 2023. The names not retired from this list will be used again in the 2029 season. This was the same list used in the 2017 season, with the exception of the names Harold, Idalia, Margot, and Nigel, which replaced Harvey, Irma, Maria, and Nate respectively. All of those replacement names were used for the first (with the exception of Nigel, only) time.
|
|
Retirement[]
In March 2024 at the 46th session of the RA IV hurricane committee, the World Meteorological Organization retired the names Gert, Katia, and Nigel from its rotating naming lists due to the number of deaths and amount of damage they caused, and they will not be used again for another Atlantic hurricane. They will be replaced with Gretchen, Kirsten, and Noah respectively for the 2029 season.
Season effects[]
This is a table of all the storms that have formed in the 2023 Atlantic hurricane season. It includes their duration, names, landfall(s), denoted in parentheses, damages, and death totals. Deaths in parentheses are additional and indirect (an example of an indirect death would be a traffic accident), but were still related to that storm. Damage and deaths include totals while the storm was extratropical, a tropical wave, or a low, and all the damage figures are in USD. Potential tropical cyclones are not included in this table.
| Saffir–Simpson hurricane wind scale | ||||||
| TD | TS | C1 | C2 | C3 | C4 | C5 |
| Storm name |
Dates active | Storm category at peak intensity |
Max 1-min wind mph (km/h) |
Min. press. (mbar) |
Areas affected | Damage (USD) |
Deaths | |||
|---|---|---|---|---|---|---|---|---|---|---|
| Arlene | February 20 – 21 | Subtropical storm | 45 (75) | 998 | None | None | None | |||
| Two | June 5 – 7 | Tropical depression | 35 (55) | 1001 | Bahamas | Minor | None | |||
| Bret | July 1 – 6 | Category 1 hurricane | 75 (120) | 982 | None | None | None | |||
| Cindy | July 3 – 5 | Tropical storm | 40 (65) | 1005 | None | None | None | |||
| Don | July 15 – 22 | Category 1 hurricane | 85 (140) | 974 | Yucatan Peninsula | $372 million | 3 (2) | |||
| Emily | August 12 – 21 | Category 4 hurricane | 150 (240) | 928 | Lesser Antilles, Cuba, Jamaica, Florida | $674 million | 10 (6) | |||
| Franklin | August 13 – 18 | Tropical storm | 60 (95) | 998 | Azores | None | None | |||
| Gert | August 22 – September 3 | Category 5 hurricane | 165 (270) | 917 | Bahamas, Florida, Georgia, North and South Carolina | $36.1 billion | 172 (108) | |||
| Harold | September 2 – 16 | Category 4 hurricane | 145 (230) | 931 | None | None | None | |||
| Imelda | September 9 – 17 | Tropical storm | 70 (110) | 993 | Lesser Antilles, Dominican Republic, Nicaragua, Honduras | $64 million | 2 (3) | |||
| Jose | September 18 – 21 | Tropical storm | 50 (85) | 1002 | New York, New England | $38 million | (2) | |||
| Katia | September 26 – October 17 | Category 5 hurricane | 165 (270) | 913 | Lesser Antilles, Greater Antilles, Yucatan Peninsula, Louisiana, Mississippi, Alabama, Eastern United States | $375 billion | 1859 (680) | |||
| Lee | September 2 – 16 | Category 1 hurricane | 85 (140) | 979 | Cape Verde | None | None | |||
| Margot | September 9 – 17 | Tropical storm | 65 (100) | 997 | Yucatan Peninsula, Florida, Georgia, The Carolinas | $427 million | 4 (2) | |||
| Nigel | October 27 – November 6 | Category 2 hurricane | 105 (165) | 970 | Lesser Antilles, Puerto Rico, Dominican Republic, Haiti | $720 million | 41 (63) | |||
| Ophelia | November 20 – 24 | Tropical storm | 50 (85) | 1001 | Canary Islands, Madeira, Europe | Minimal | (1) | |||
| Season aggregates | ||||||||||
| 16 systems | February 20-November 24 | 165 (270) | 913 | $413.3 billion | 3058 | |||||